Startup Postmortem - The Red9 Story
17 Feb 2018![]()
Most startups fail. Red9 was one of those, and this is that story.
I want to share a story about three years of my life. Three years trying to create something where there was nothing before, from the ground up, and with a small team of enthusiastic and passionate people. We set out to quantify the athlete and help them perform better. By the end, we realized that our approach was ineffective, and we could not create the company that we wanted.
In this post I’ll share what we did, why we made the choices that we did, and why Red9 failed. This post is a combination of timeline and my personal experience, with all the bias that brings. I’ll cover both the technical and the business side of Red9. Understanding the Possibilities When I joined Red9 in the summer of 2012 the company was a small group of people with an idea and a few prototypes. Mike and Mica, the founders, had seen the low cost MEMS accelerometers and gyroscopes hit the market, along with small integrated GPS modules. They figured that something interesting could be done with that hardware to measure athletic performance. We didn’t really have a concrete sport in mind, or even a defined business plan at this point. Mike was the business guy, and Mica was the engineer. Also on the team was Mike’s brother, Jeff, another business type.
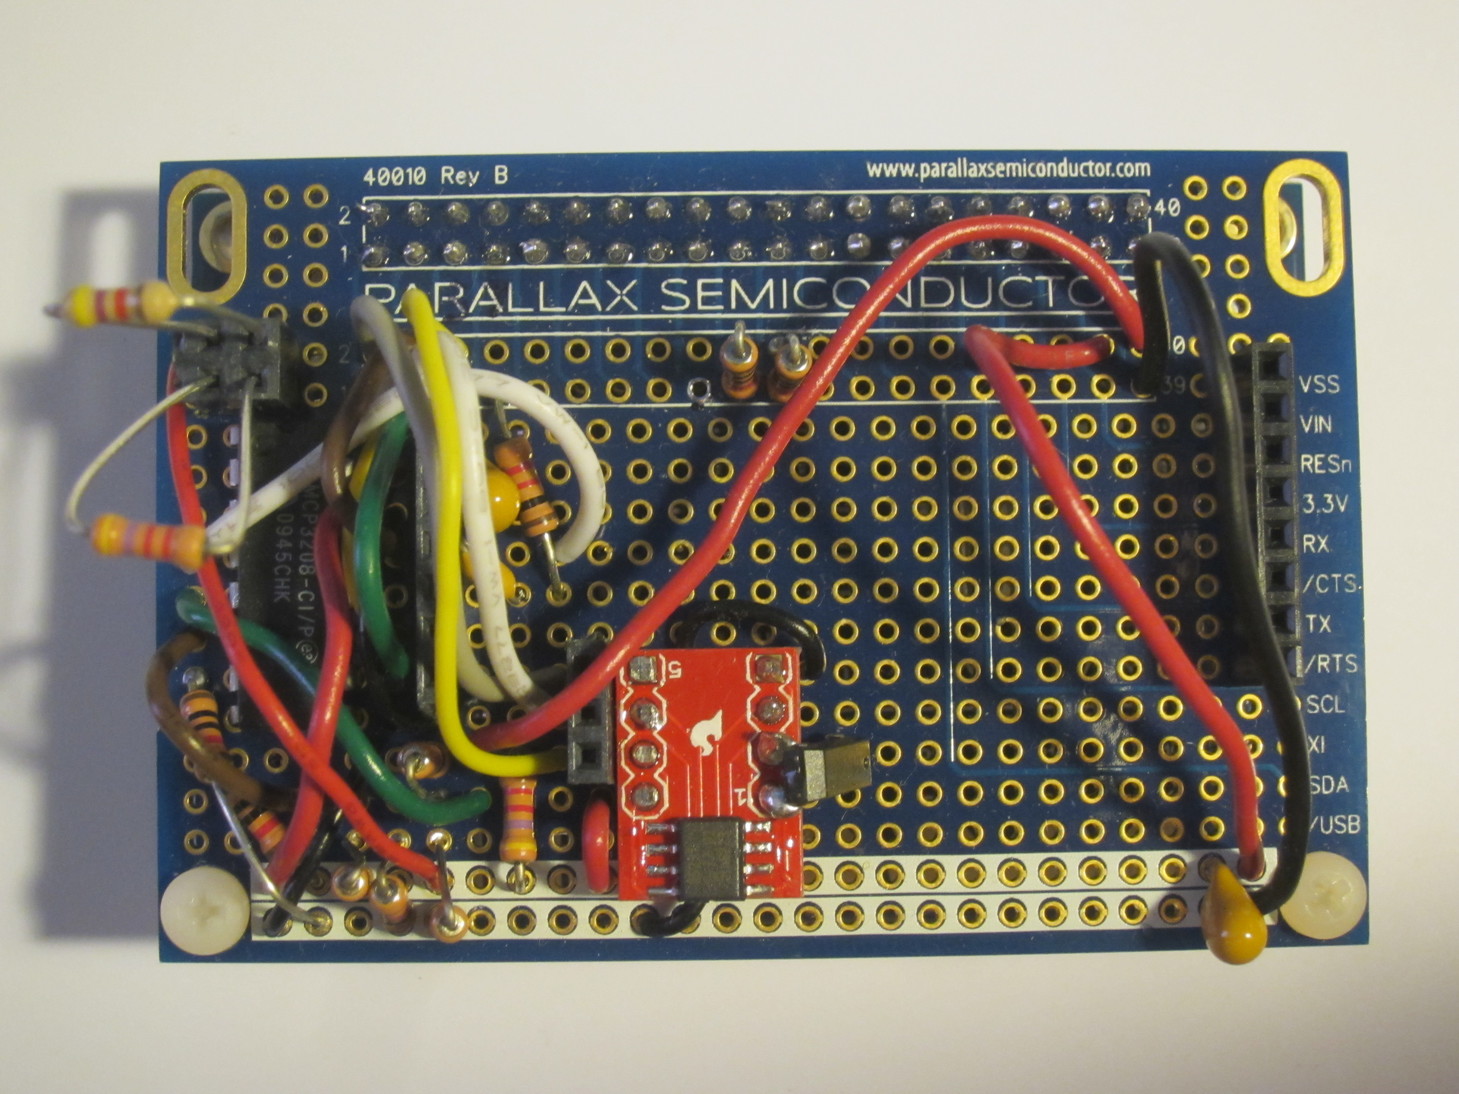
Before I joined, Mica had built a few prototypes using hand soldered protoboards for the electronics and tupperware for a protective case. Mike and Mica brought me on to help out on the technical side of things and advance the prototype to something that was more usable. I started working for Red9 on improving the recorder. The requirements were somewhat undefined. All that we knew was that we wanted to try sports like skateboarding, snowboarding, biking, and surfing. I was the first and only full-time employee of Red9.
Over the years, the rough plan was to build a motion recording device, attach it to an athlete, and then use data science to post process the data and make sense of it all. From the beginning we self funded, with our own cash and sweat equity. We never had any outside investors.
During the first year I experimented with hardware and firmware. I designed and built a series of recorders nicknamed SCAD (Self Contained Automatic Datalogger). These recorders had onboard GPS, IMU, altimeter, Bluetooth, and memory, and were designed simply to record these sensors for later data analysis online. Each was hand built in my office, using tweezers as pick and place and a repurposed toaster oven to solder everything. This process worked surprisingly well as long as the fumes didn’t drive me out.
For the first two generations, codename Alpha and Beta, I designed the PCB to fit into an off the shelf case. It was a two layer, single sided design, with about half of the PCB dedicated to a prototyping area.
In this first year I designed three generations of the recorder. The first version was the first PCB that I ever designed, and the second version was a “cleaned up” revision (embarrassingly, the first one didn’t even boot). The third and final generation, Gamma, was what we thought of as “feature complete and nearly shippable”.
For the final generation I settled on a double sided four layer 1.3” x 2.1” x 0.3” PCB with the following features:
- 96MHz P8X32A Parallax Propeller processor
- 3 axis +-16G, +- 8.1 gauss LSM303DLHC accelerometer and magnetometer
- 3 axis +- 2000dps L3GD20 gyroscope
- 10cm resolution MS5611 barometer
- 10Hz PA6H GPS
- latching microSD
- chip antenna RN-42 Bluetooth
- digital MAX17048 fuel gauge
- integrated MAX8819 lipo charger and regulator
- FTDI FT232RQ based USB
- 3 LED user feedback (recording, battery, GPS lock, Bluetooth)
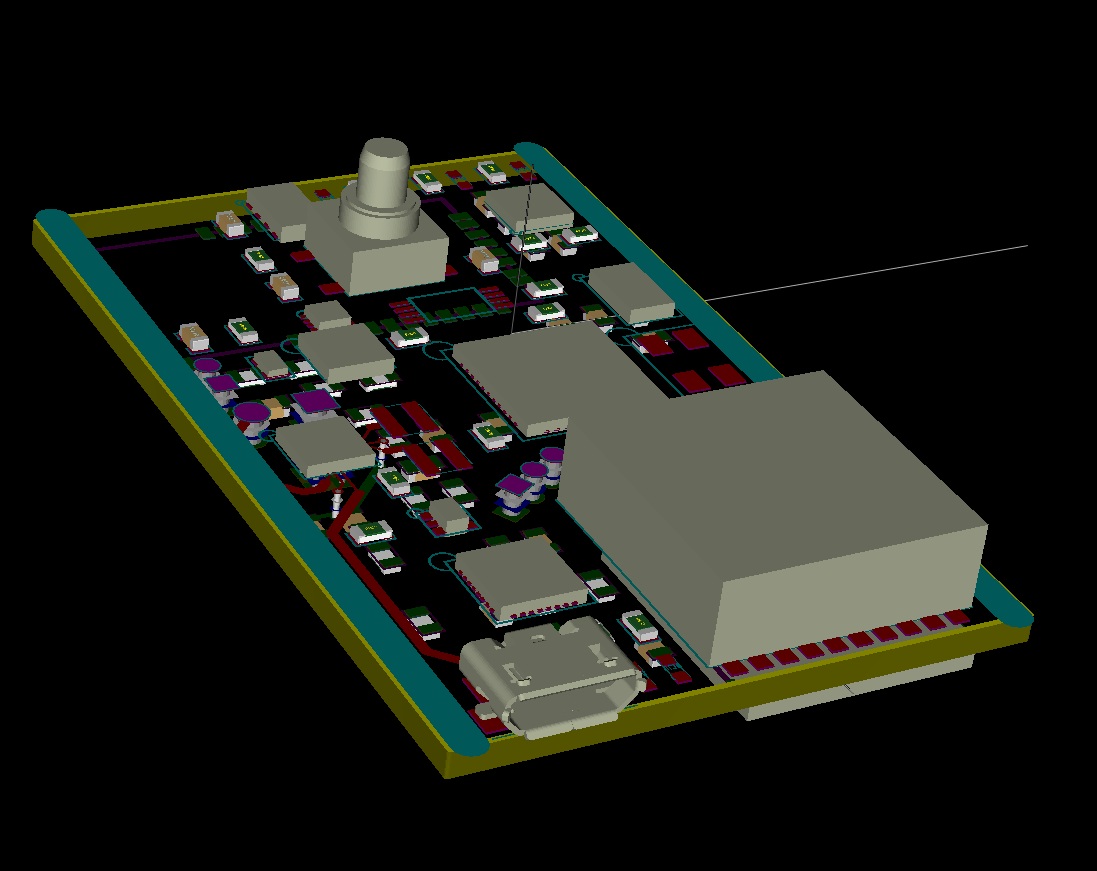
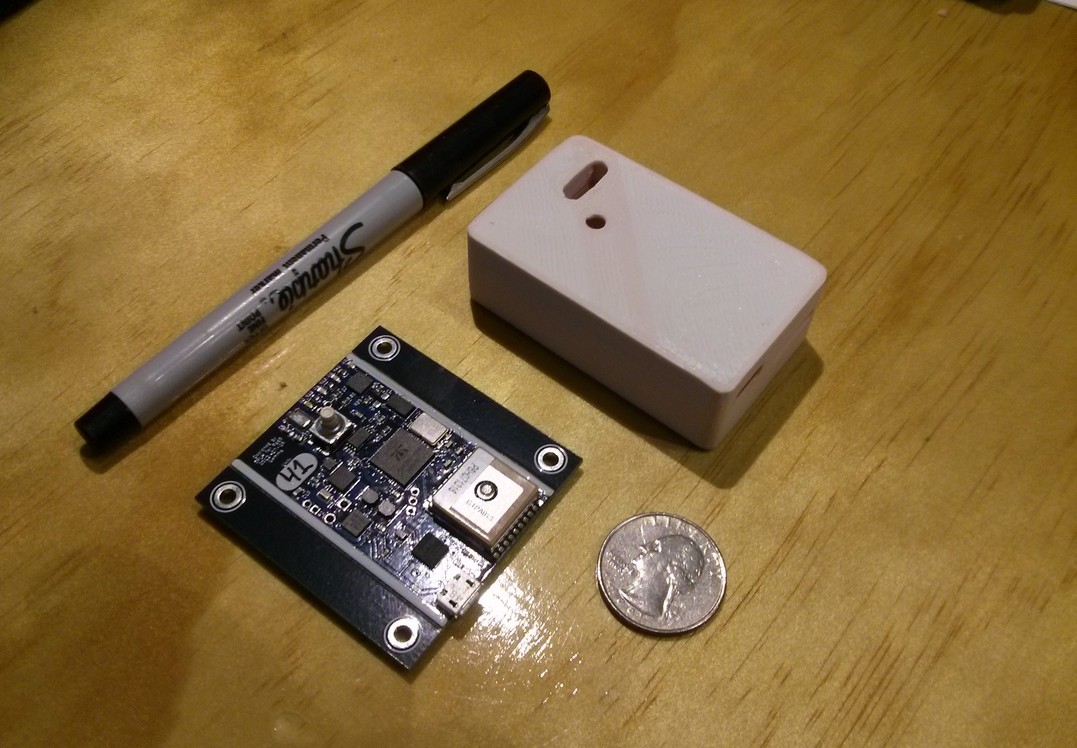
This shows a CAD rendering of the final model. After we got the final design, I provided the 3D model to Mica. Over the next few years he designed, built, and tested a series of tough and waterproof 3D printed cases.
 |
 |
|---|---|
 |
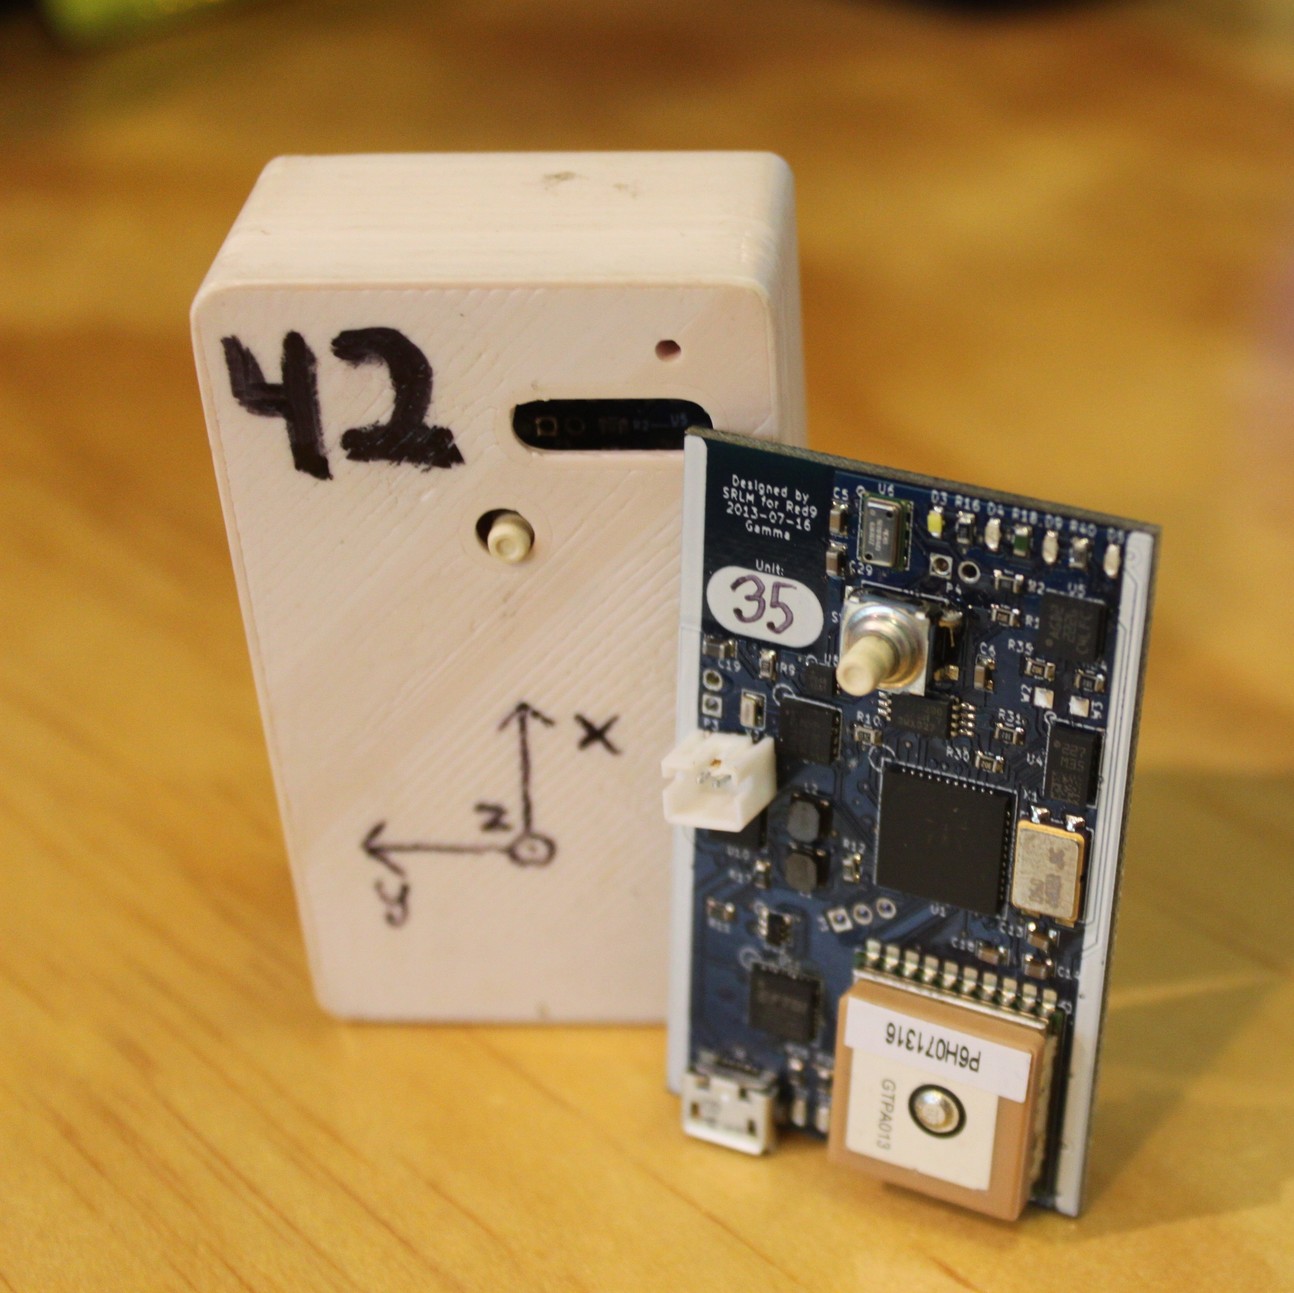 |
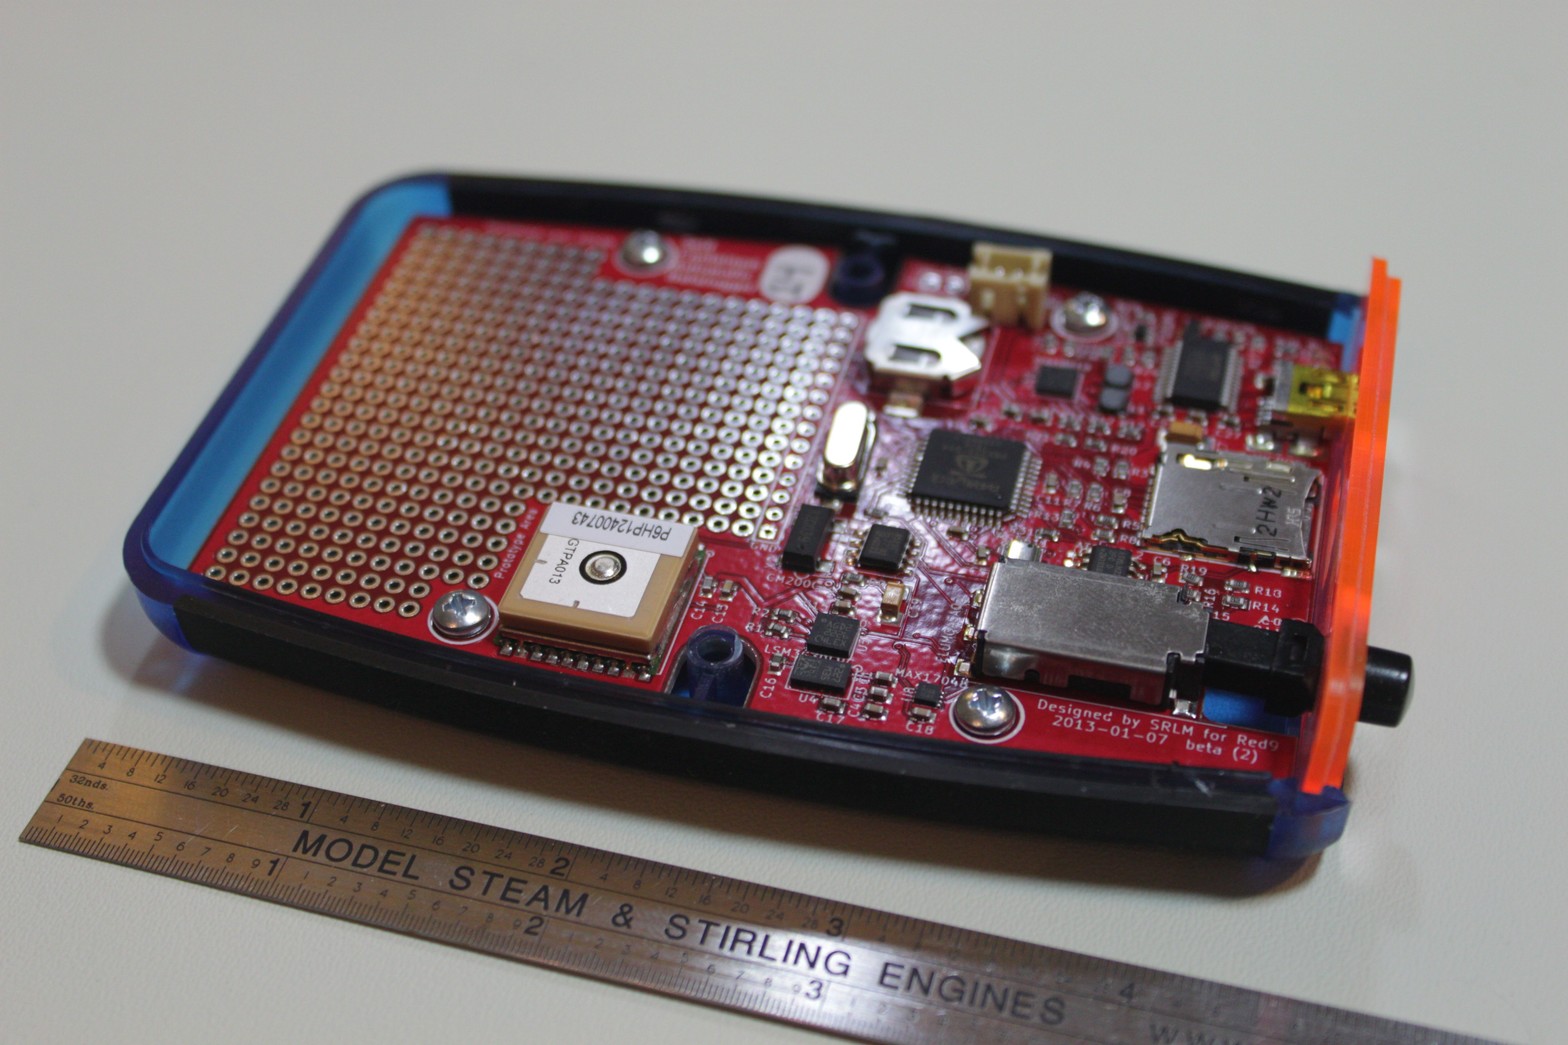
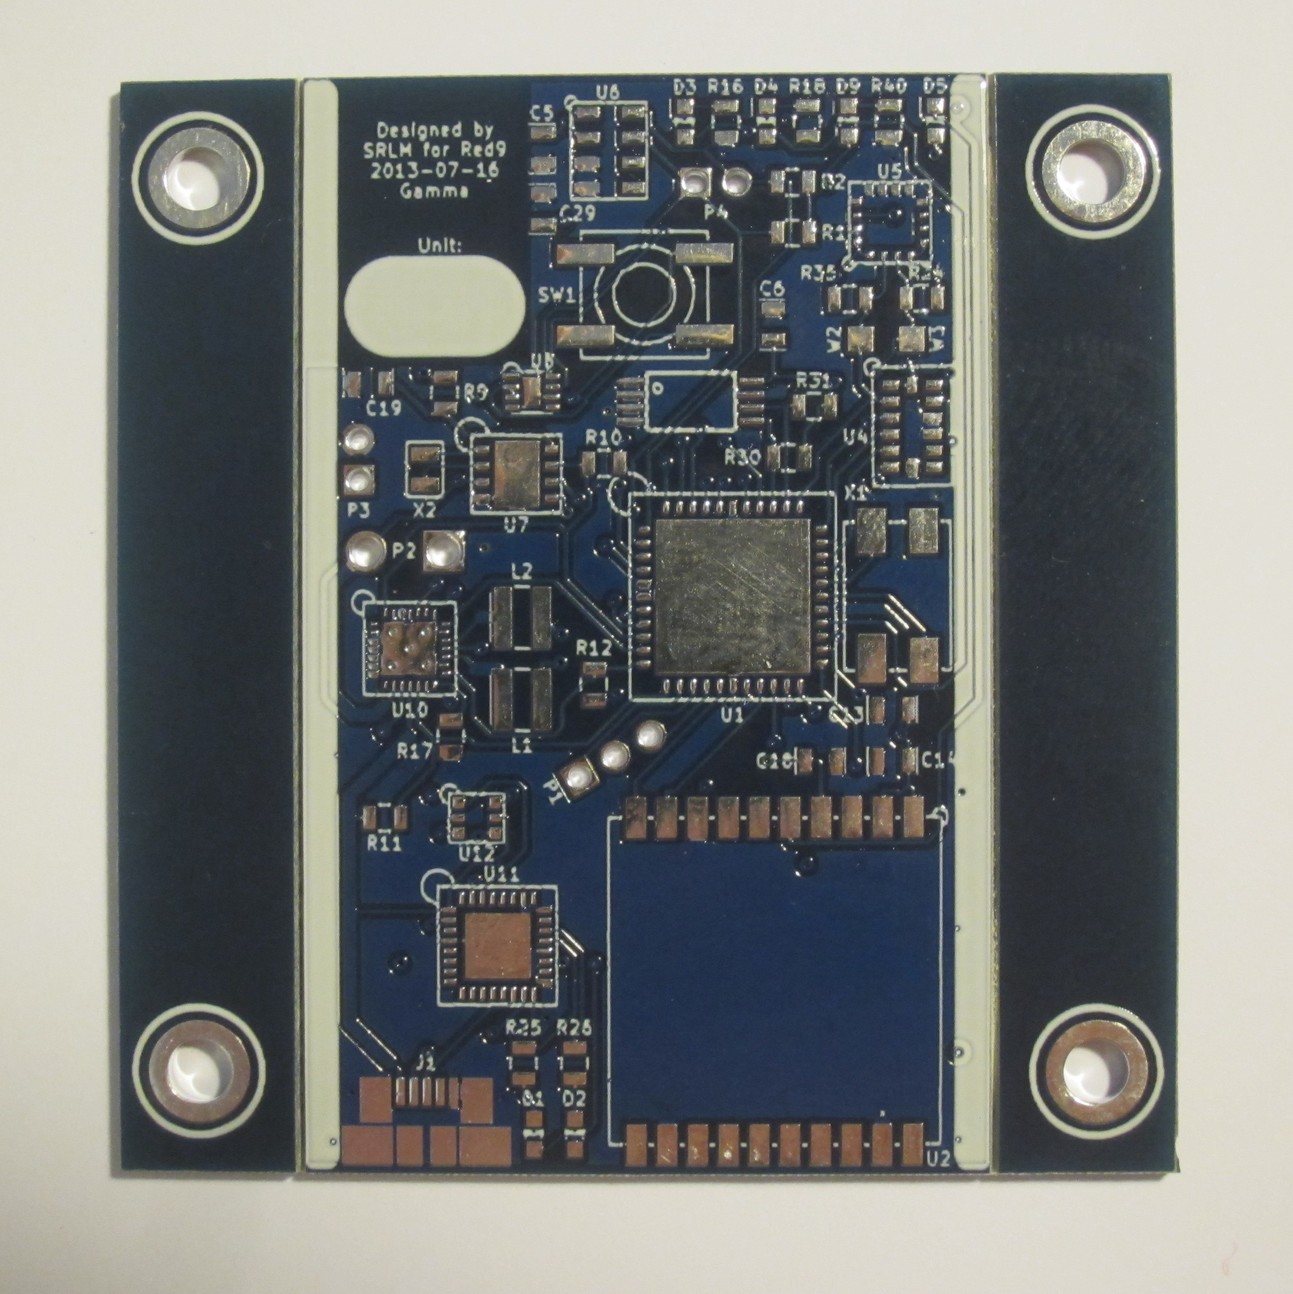
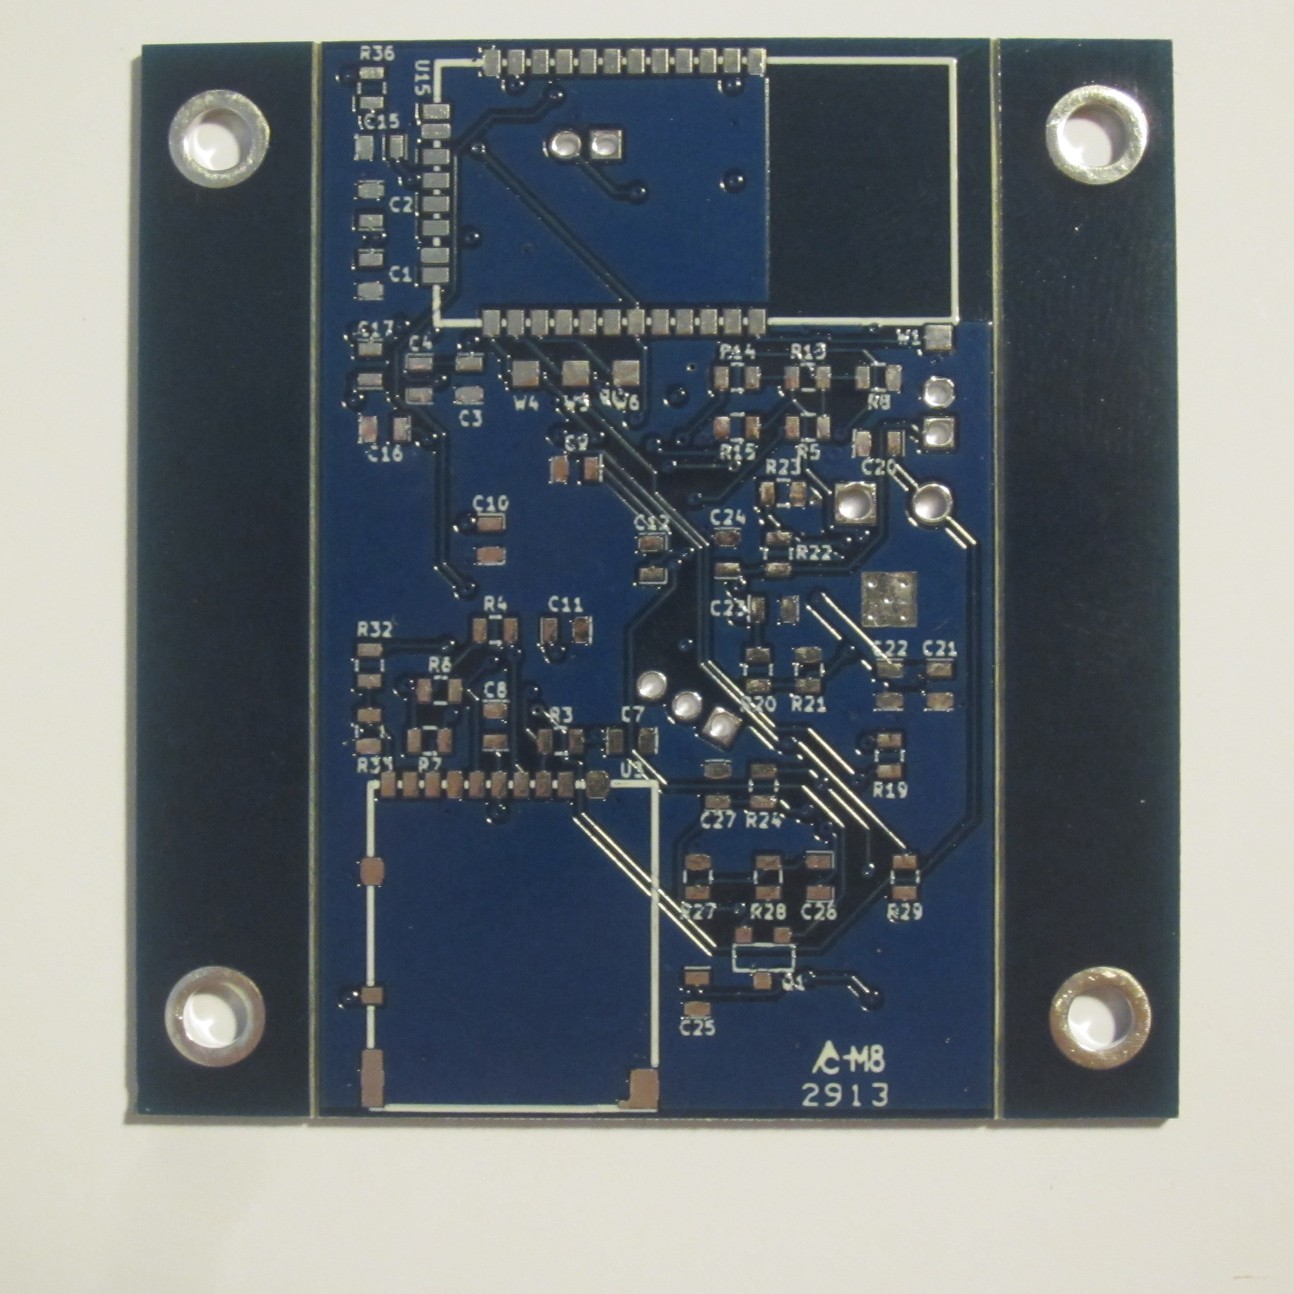
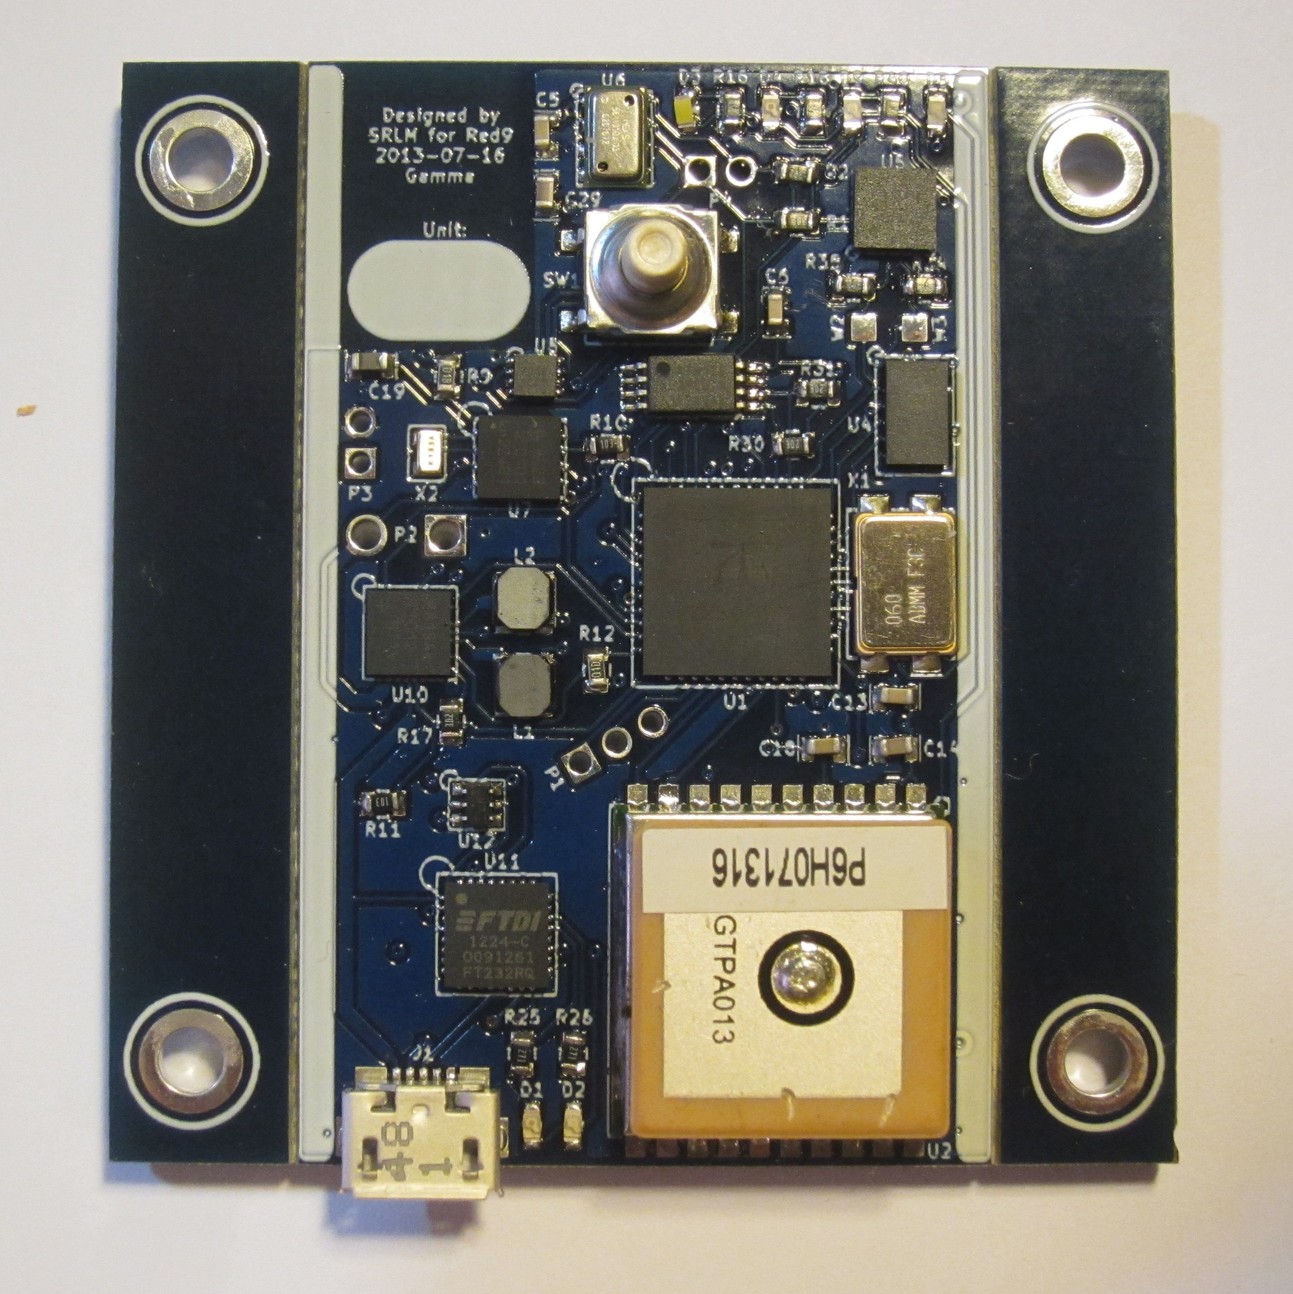
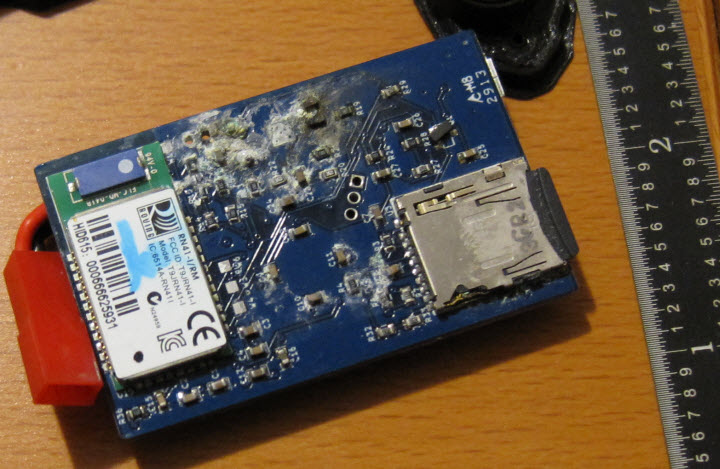
This view shows the front and back of the SCAD device, Gamma (the third and final) generation. The most challenging part to solder was the MAX8819, a 28 pin TQFN with 0.4mm pin spacing (left image, vertical middle, far left hand side). The finicky nature of this one chip forced me to rework at least half of all boards I produced. Lesson learned: when hand soldering, sacrifice a bit to get QFP packages, or at least bigger QFN packages. I never had a problem soldering the Propeller chip, and the others (accelerometer, gyro, FTDI, RTC, and baro) rarely presented a problem.
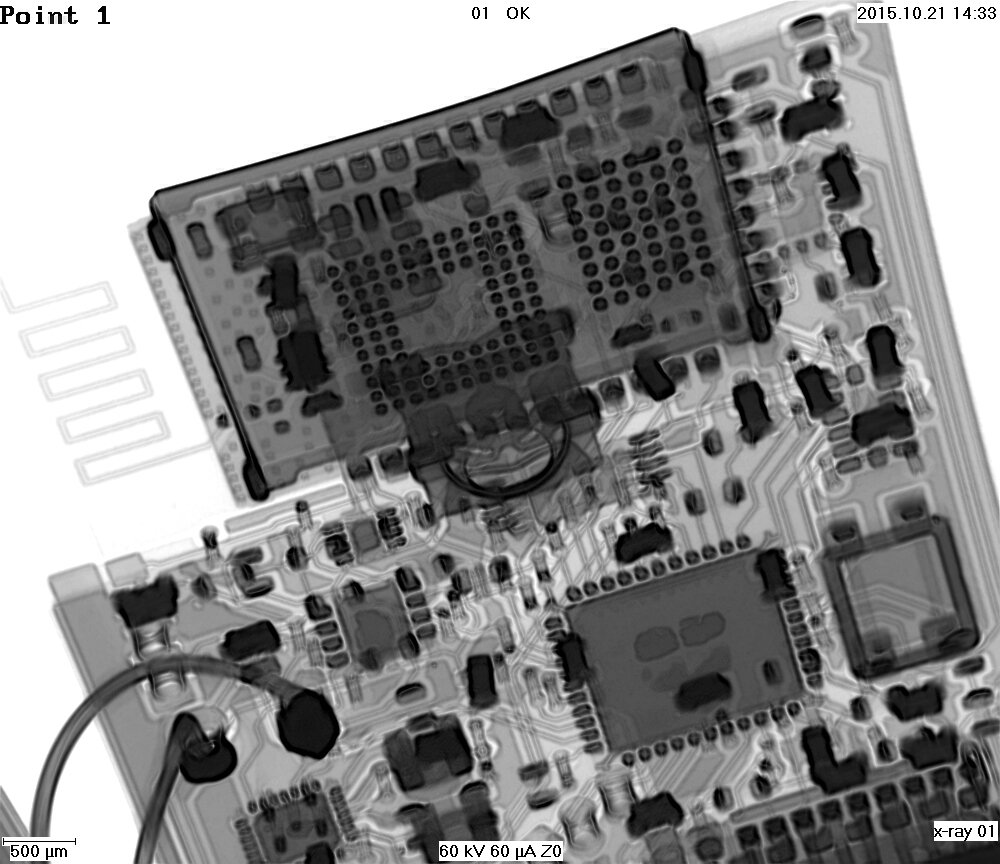
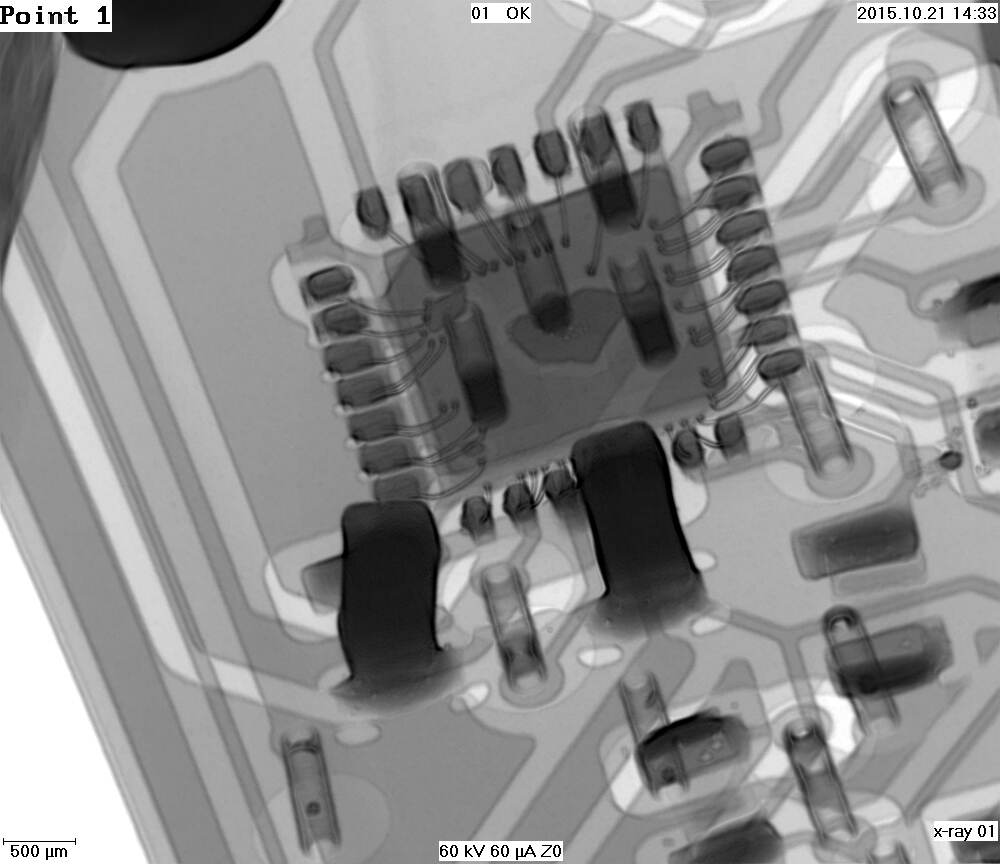
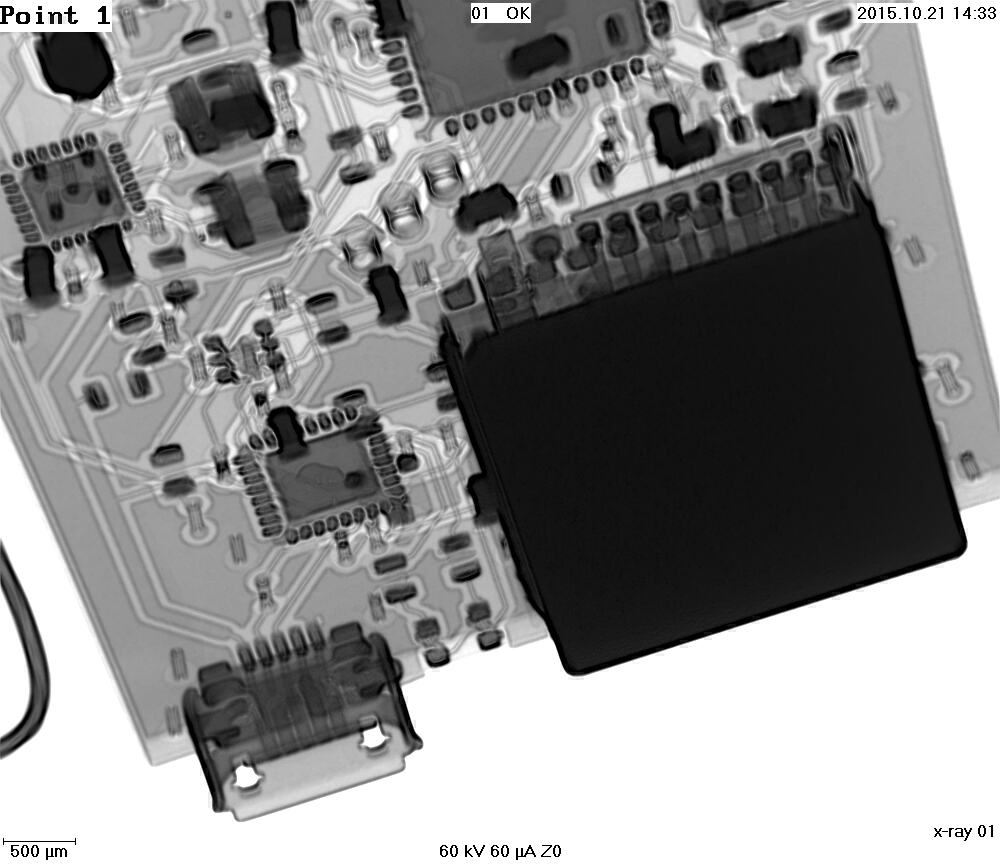
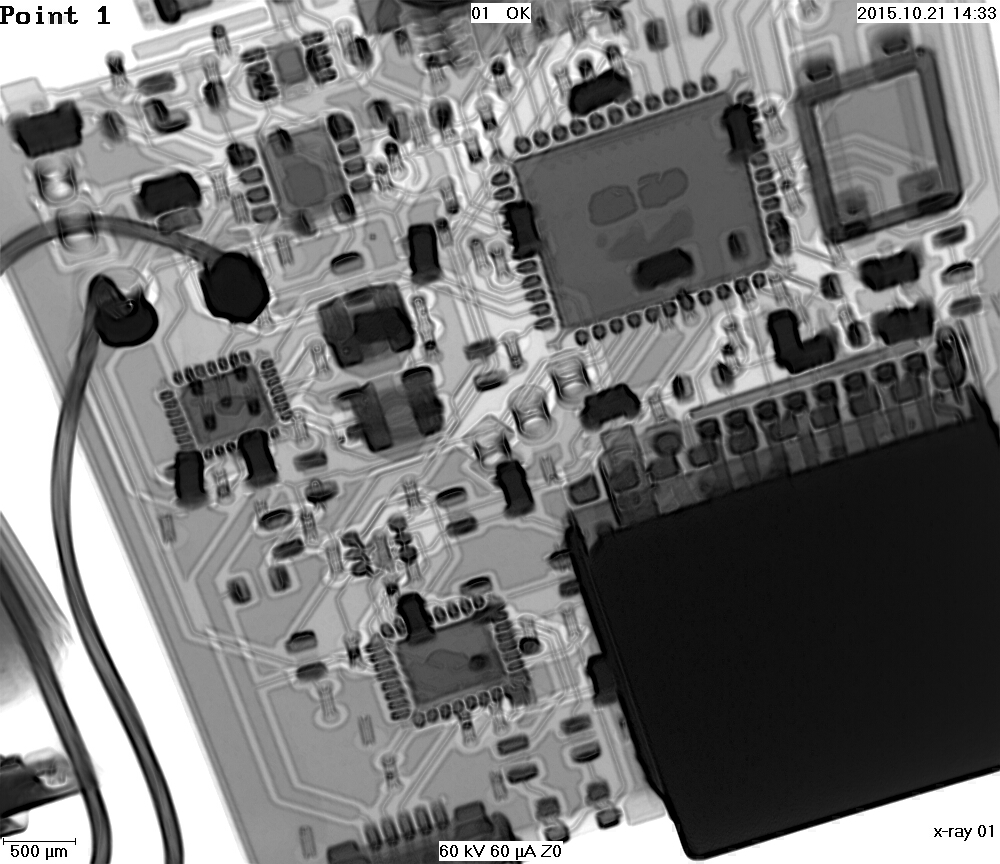
A few years after I designed the board, I got the chance to run them through an x-ray machine. As it turns out, my soldering was pretty good, even in the hidden areas.
 |
 |
|---|---|
 |
 |
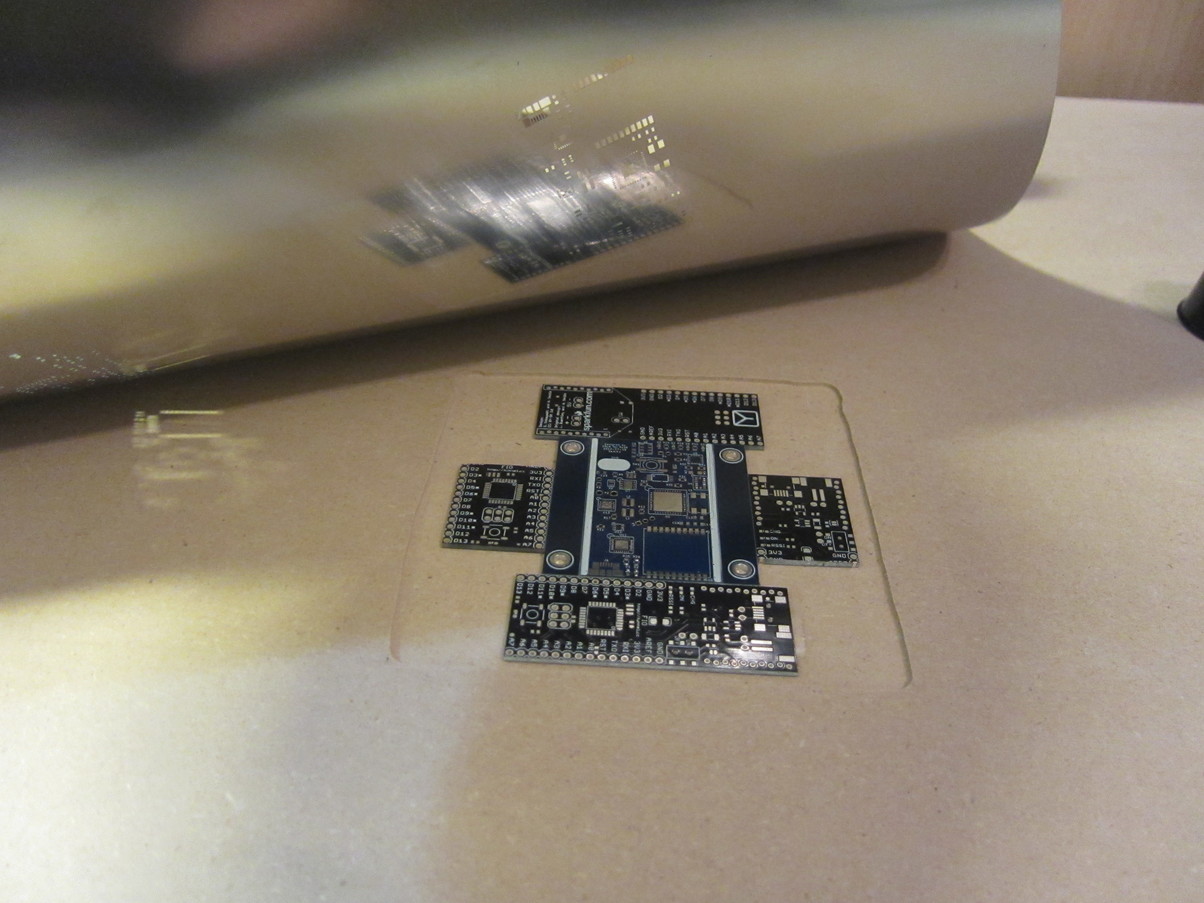
Since this board is so small and densely packed I added some “wings” to the PCB to aid in assembly by making the board bigger. Every square millimeter of the main board was covered in components, so using these wings allowed me to stencil paste onto the board and reflow without affecting the bottom side components. The wings are designed to snap off when assembly is complete.
 |
 |
|---|---|
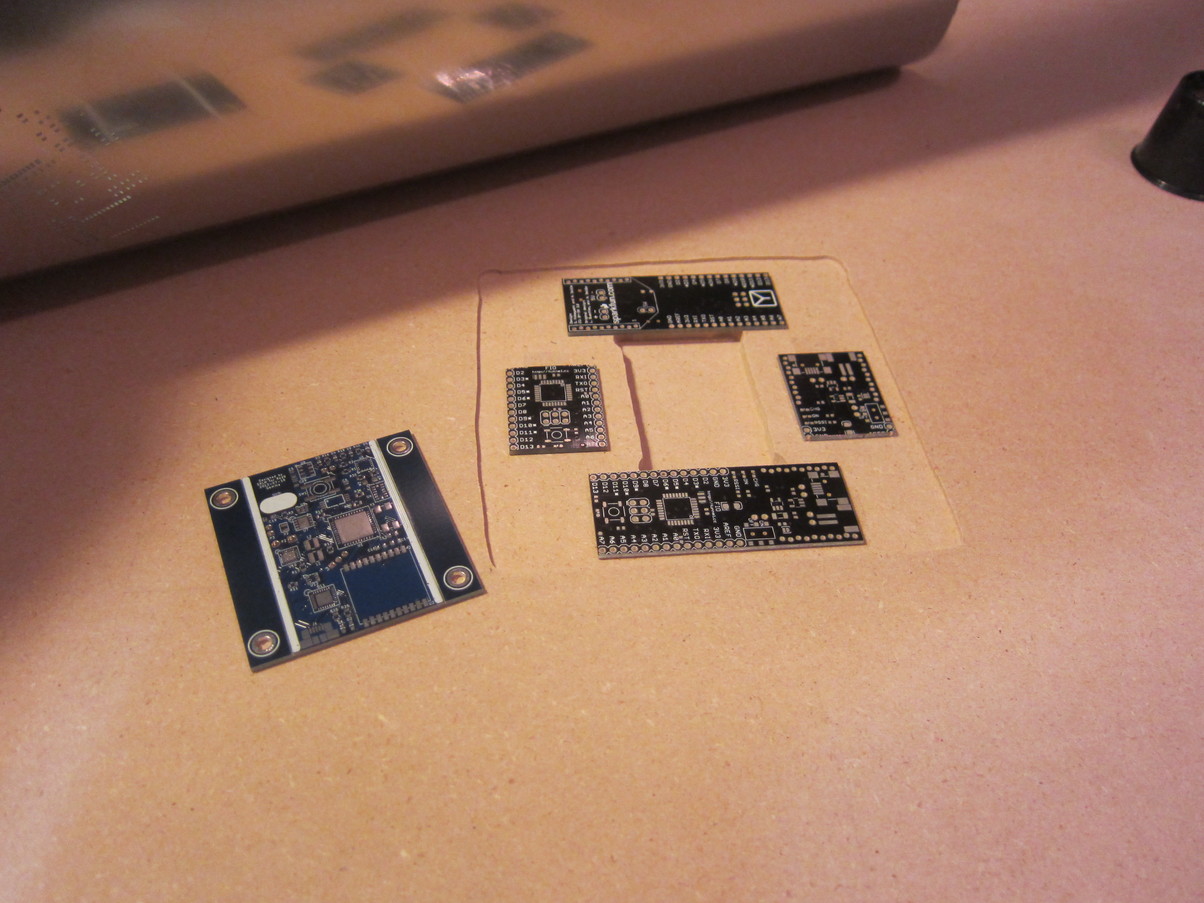
| The final generation prototype | Early prototype compared to final generation |
Some of the components that I spec’d out were rather small, so I had to design and have a stepped stainless steel stencil cut. This stencil allowed me to quickly populate all 300+ pads with solder paste.
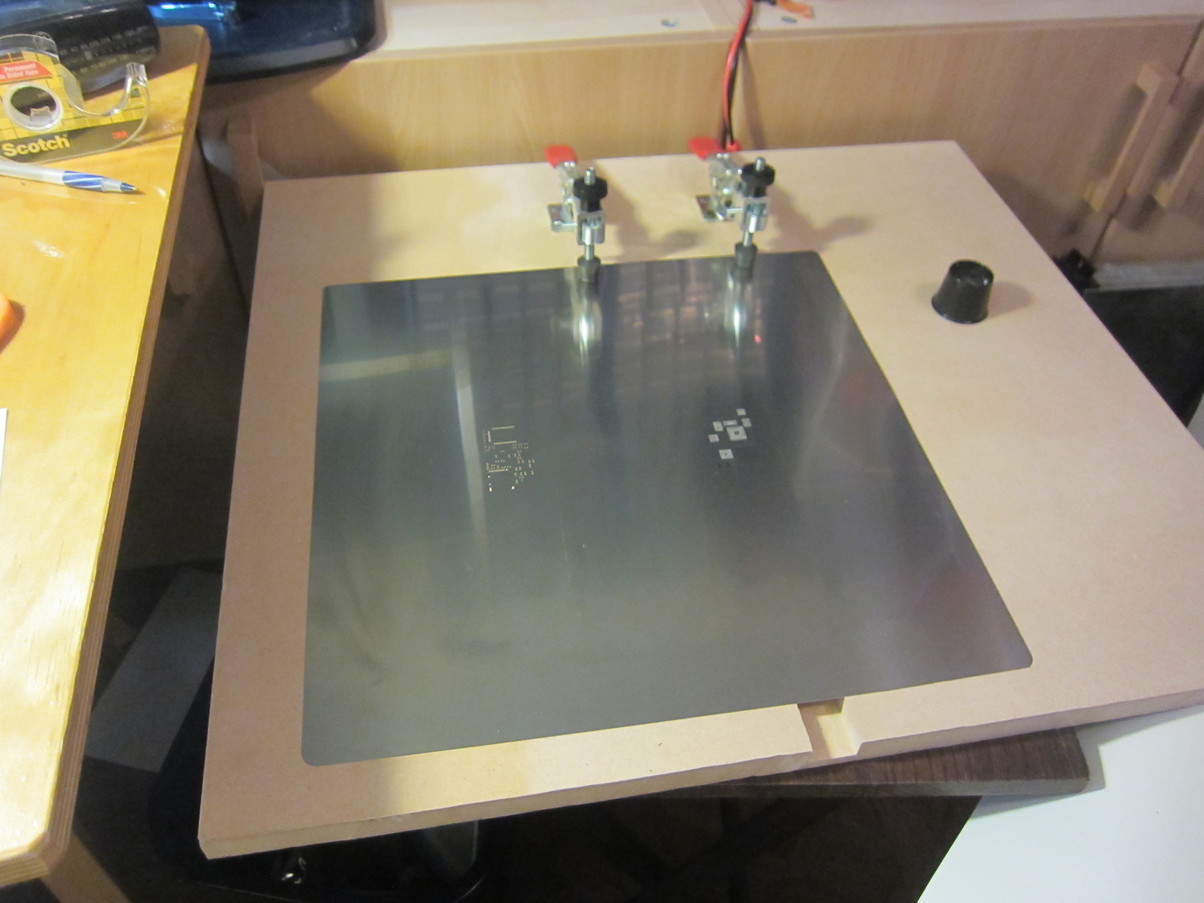
Here the stencil is down, ready to use.
 |
 |
|---|---|
Here the stencil is up, showing how the board was positioned underneath. I routed out a two level pocket in the MDF that provided a place for the populated bottom side components to fit, and a ledge that put the surface of the PCB flush with the MDF, which allowed the stencil to sit flat. I even included some of the ubiquitous toggle clamps to hold the stencil steady as I spread the solder paste.
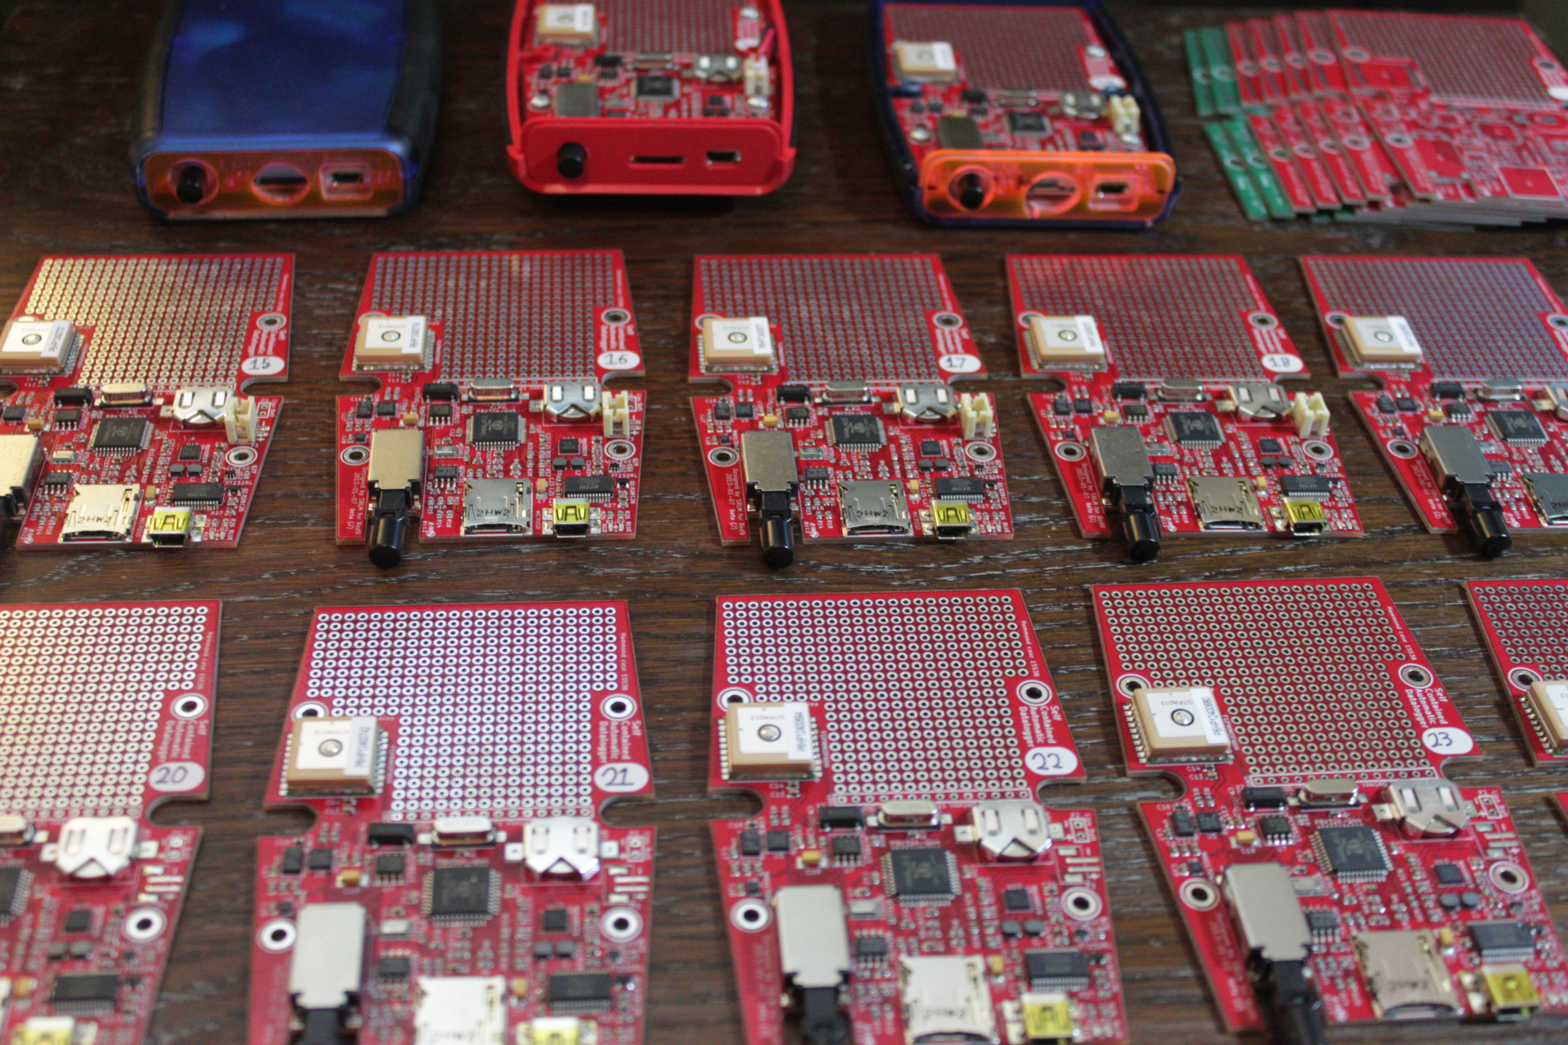
Each gamma board ended up at about $300: $150 for the parts, and $150 for the assembly. Overall, I built 19 red Beta boards and 49 blue Gamma boards over four build sprints.
All PCB design files can be found on GitHub.
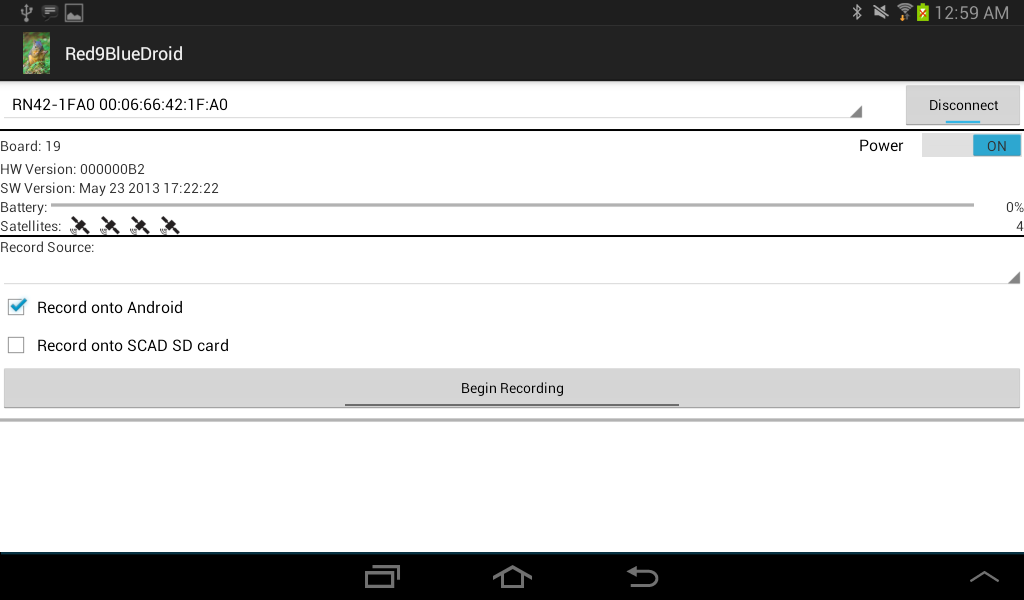
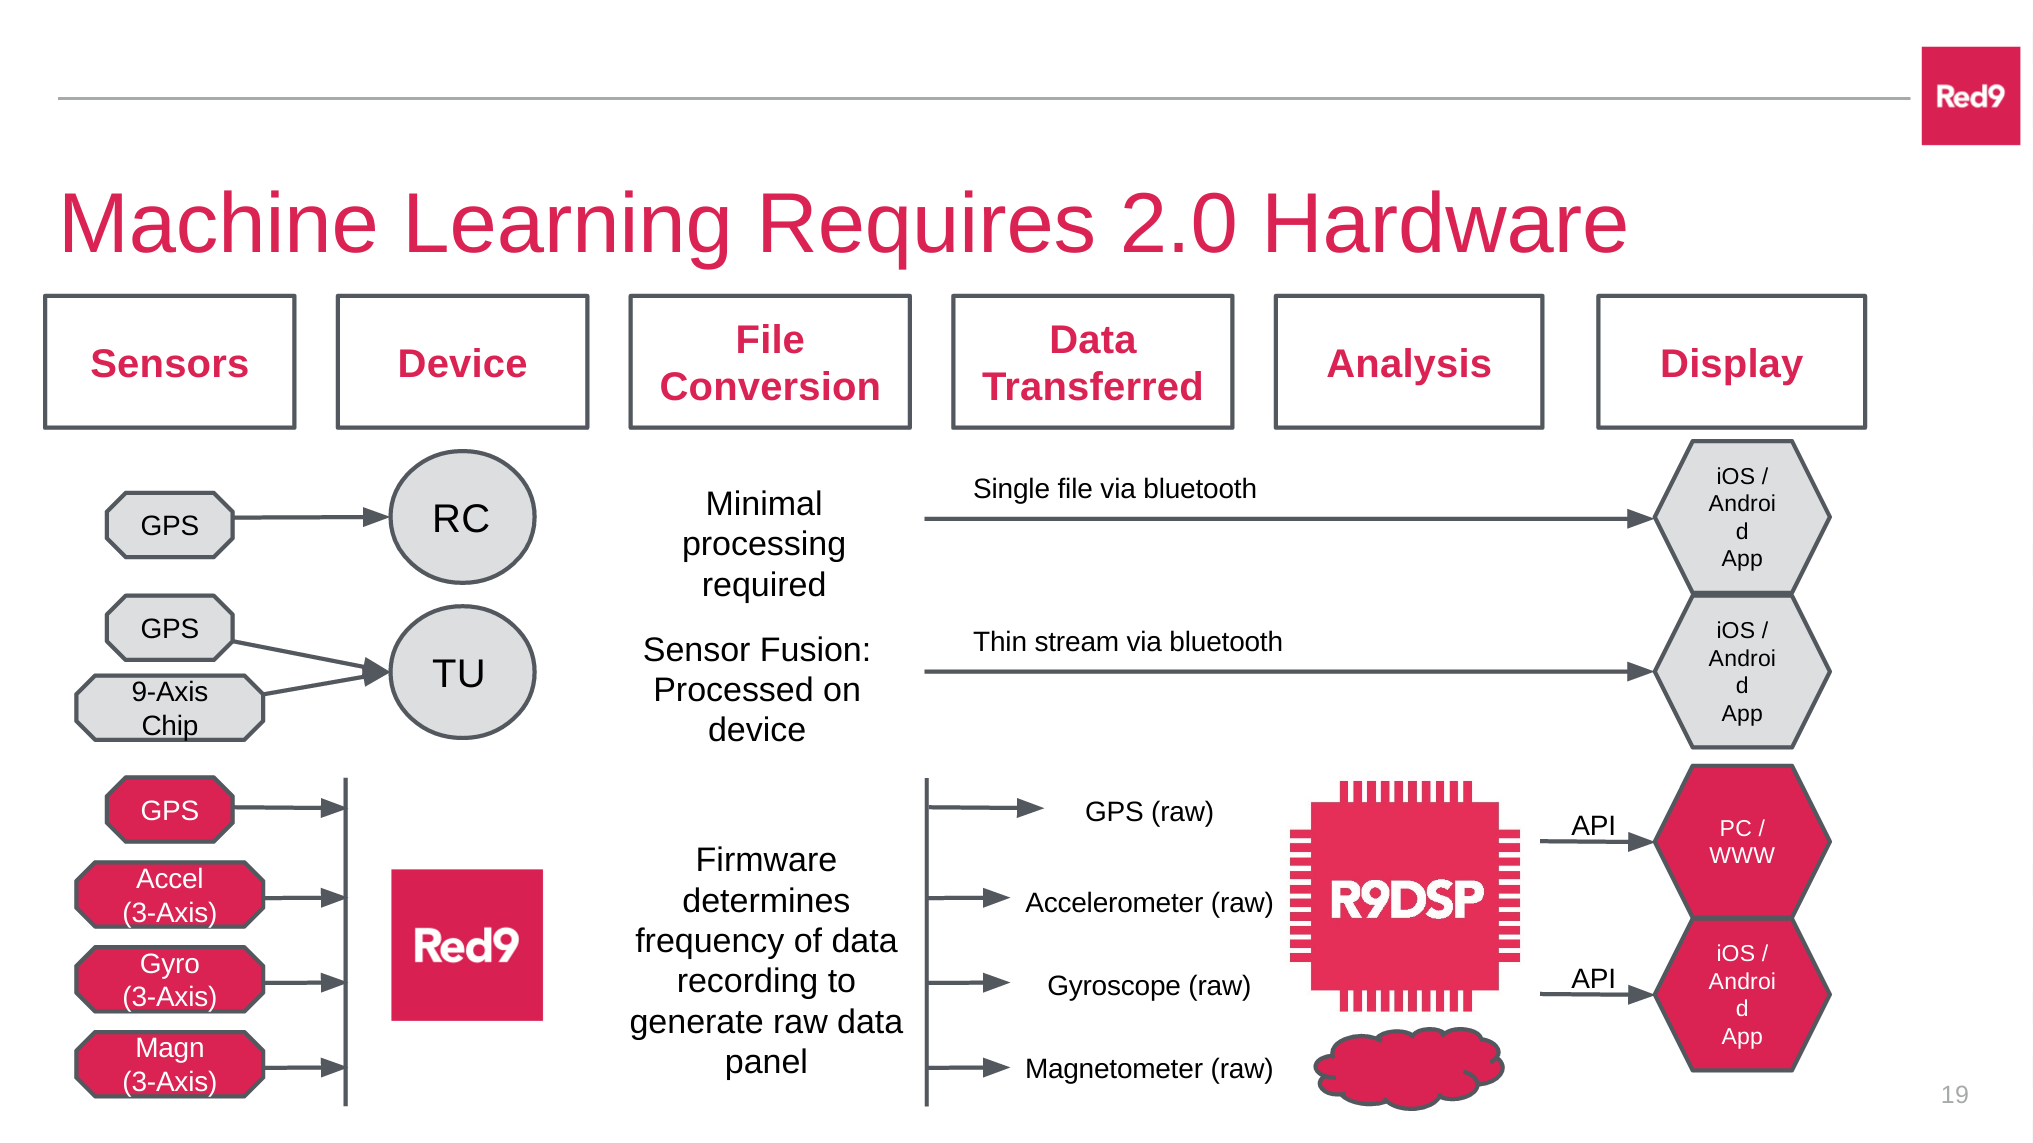
After building the devices we needed some software to actually record the data. The SCAD records the data in a compressed format at 150Hz or more (~20MB/hr) onto a standard microSD card of up to 32GB in size. It is charged at 500mA via a standard USB port and can run from 6 to 8 hours, depending on the installed battery. Data can be retrieved by inserting the microSD card into a PC or over the air using the native Android Bluetooth app I wrote.
The software consisted of a main monitor and control program, and a bunch of classes for the different peripheral components. An open source library is very useful when it contains standalone, modularized components. With this in mind, I wrote libpropeller, an early (the first?) C++ library for the Propeller.
libpropeller had two groundbreaking features. The first was putting all code into C++ headers. Despite internet rumors, this actually reduced code size and made it faster. Additionally, splitting code across two separate files as is the norm in C++ is really annoying to develop for.
The second innovation, and for which I’m really proud, is the unit testing of the library. Most of the C++ classes come with a set of tests that are designed to check the functionality of the code. Traditionally embedded systems are difficult or impossible to unit test. For libpropeller I designed a special unit testing board and framework that allowed actual, hardware in the loop, testing of some of the most important code in the library. The I2C routines and PWM routines were tested this way, in addition to others.
With libpropeller, I wrote a pretty comprehensive Propeller program to read seven sensors at 100Hz, record the data to an SD card, and respond to a Bluetooth API, all in 32k of memory with C++. The code now lives on GitHub.
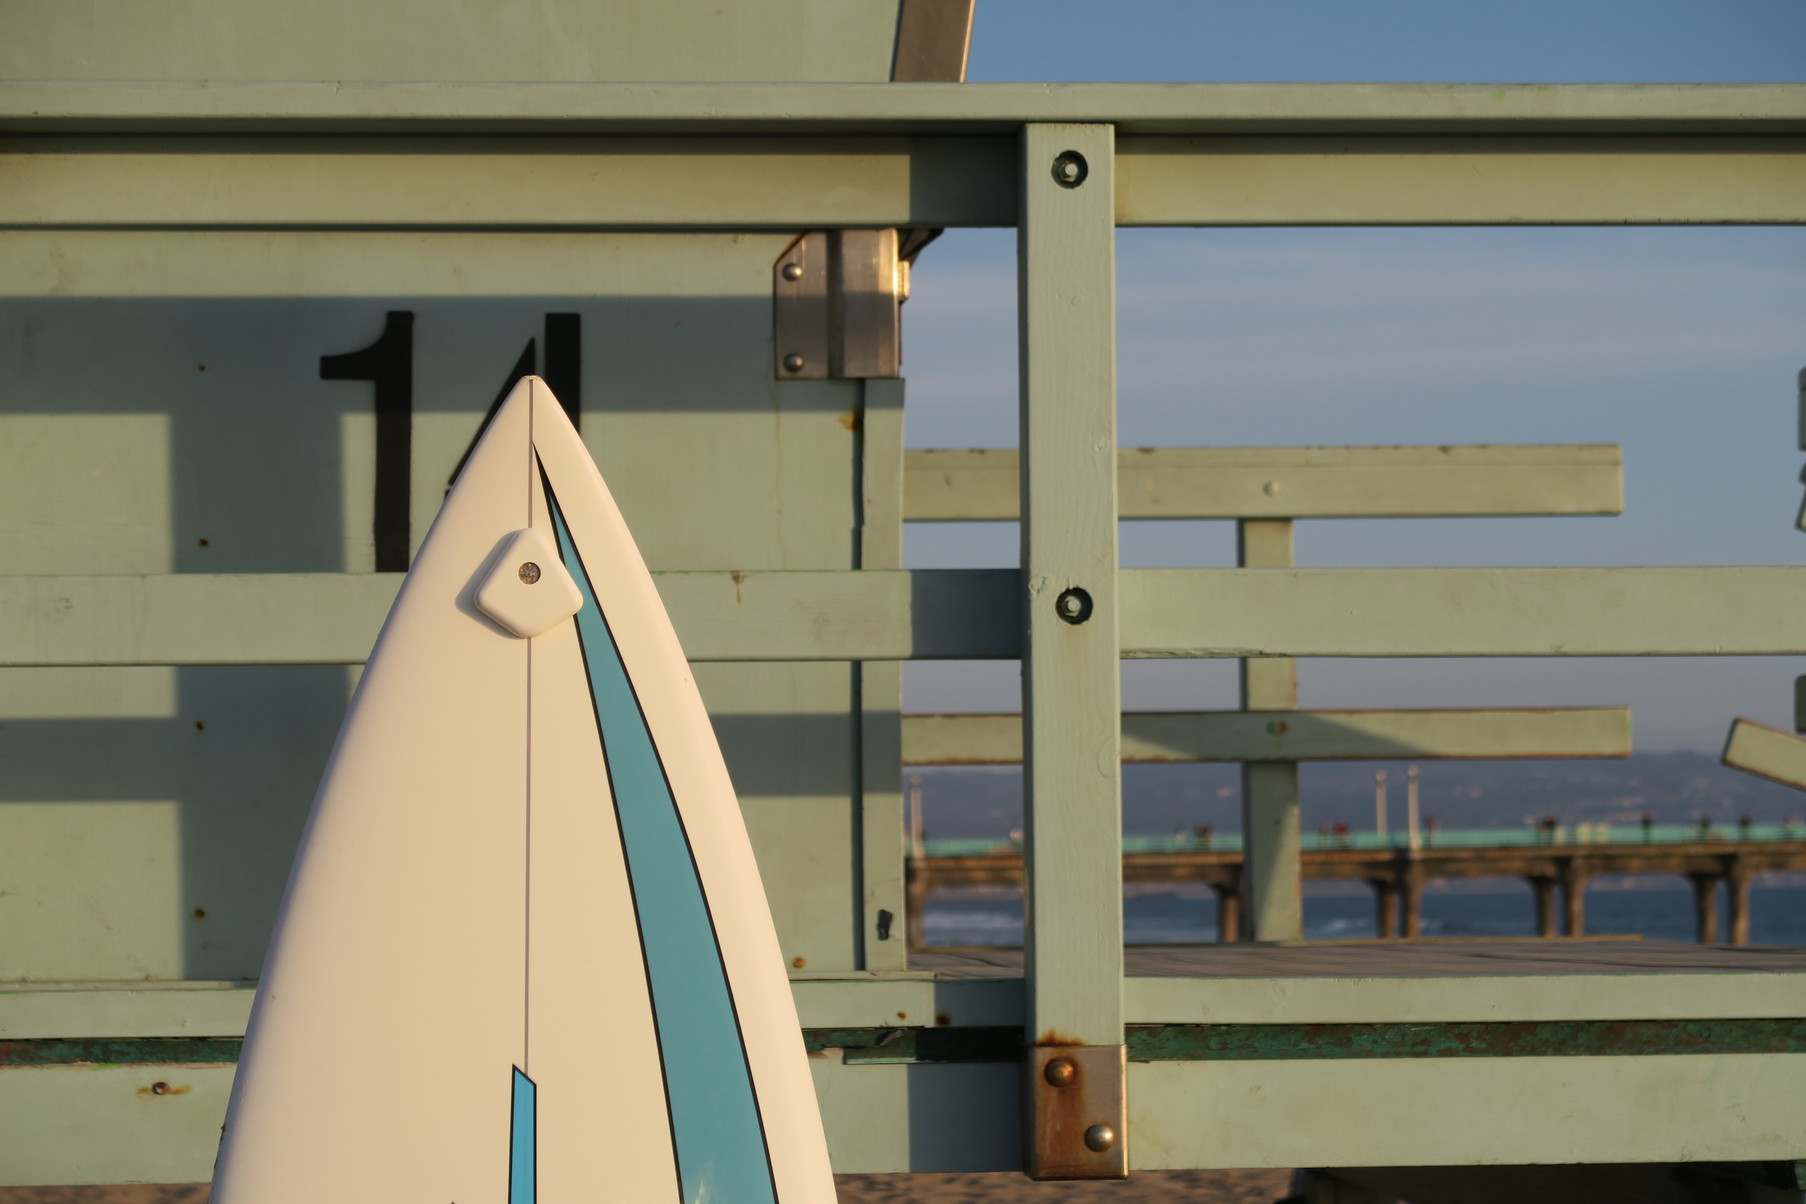
After the first year with Red9, as I was wrapping up the Gamma design, we were settling into what could be done with the hardware and needed more definition for the company direction. Mike and Mica decided that we would focus on quantifying surfing. Surfing is an interesting sport, and at the time didn’t have any devices to record motion through water and count your waves. As we discovered later, choosing surfing was one of the two company killing mistakes that we made.
Within a few early surfing sessions, we learned a few important things
- Waterproofing is hard.
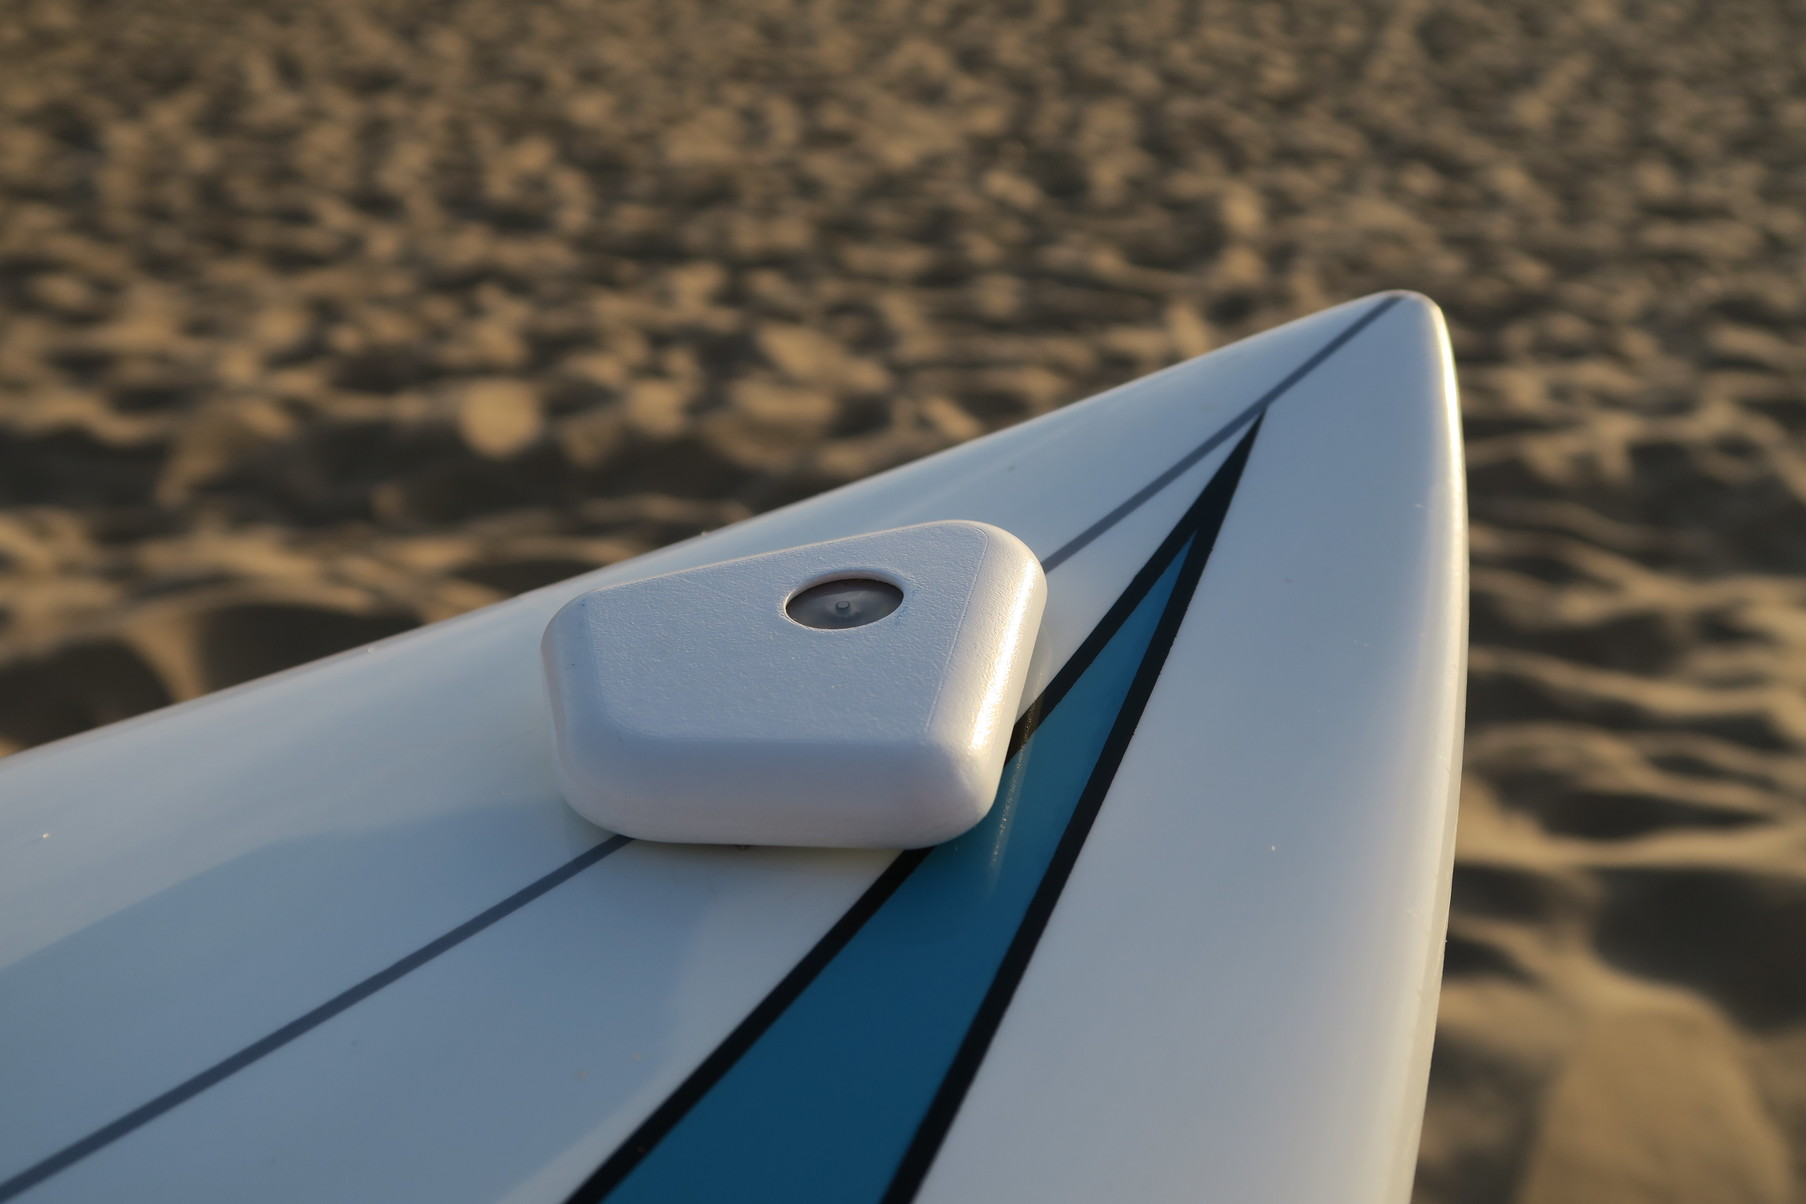
- Staying attached to the nose of the surfboard is hard.
- Data analysis is hard.
I designed Gamma to be as small as possible, without a concrete consideration for the design of the case. Mica, the CAD expert, was working on other things at the time, so that left some room for experimentation with case design.
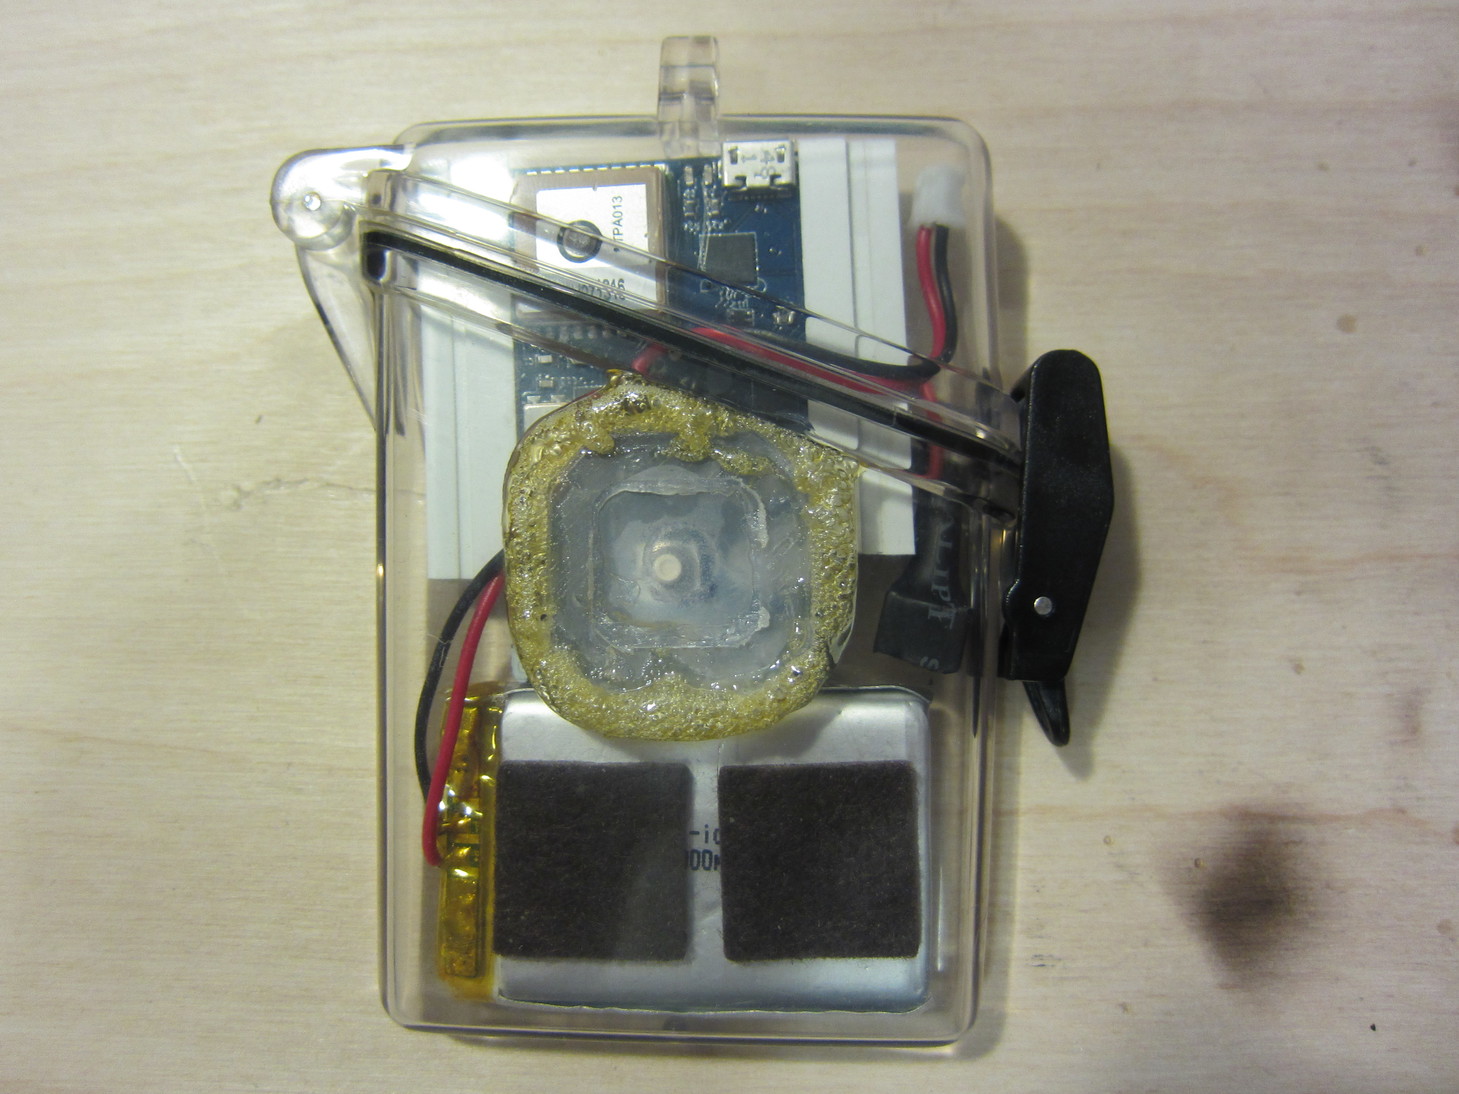
Unfortunately, when Mike tried this out on his surfboard we got a vivid demonstration that surfing is a violent sport, with pounding from the waves and occasional accidental kicks to the recorder by the surfer themselves. The latch on this off the shelf case proved to be too easy to knock loose, and when it did the case leaked and all the electronics instantly turned into a big salty mess.
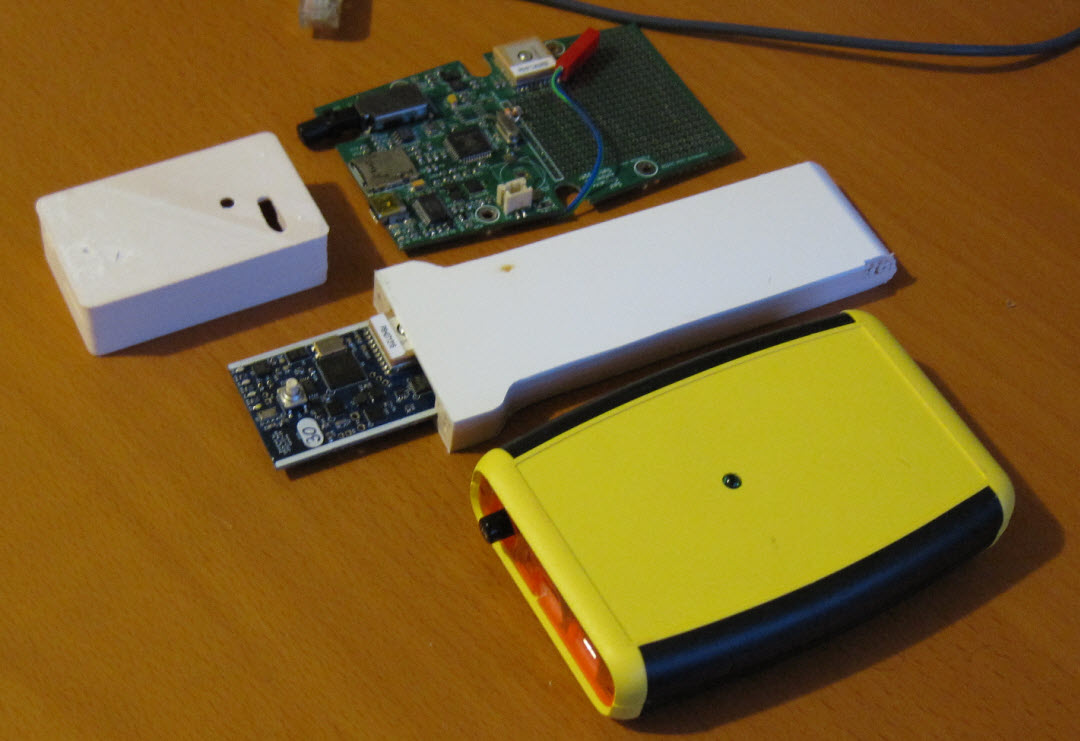
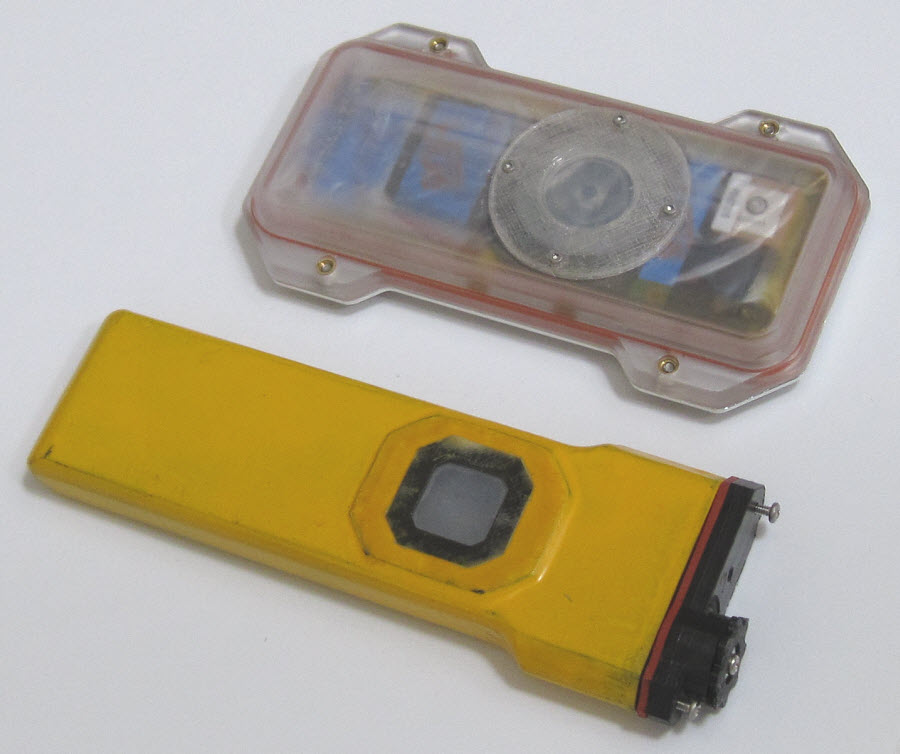
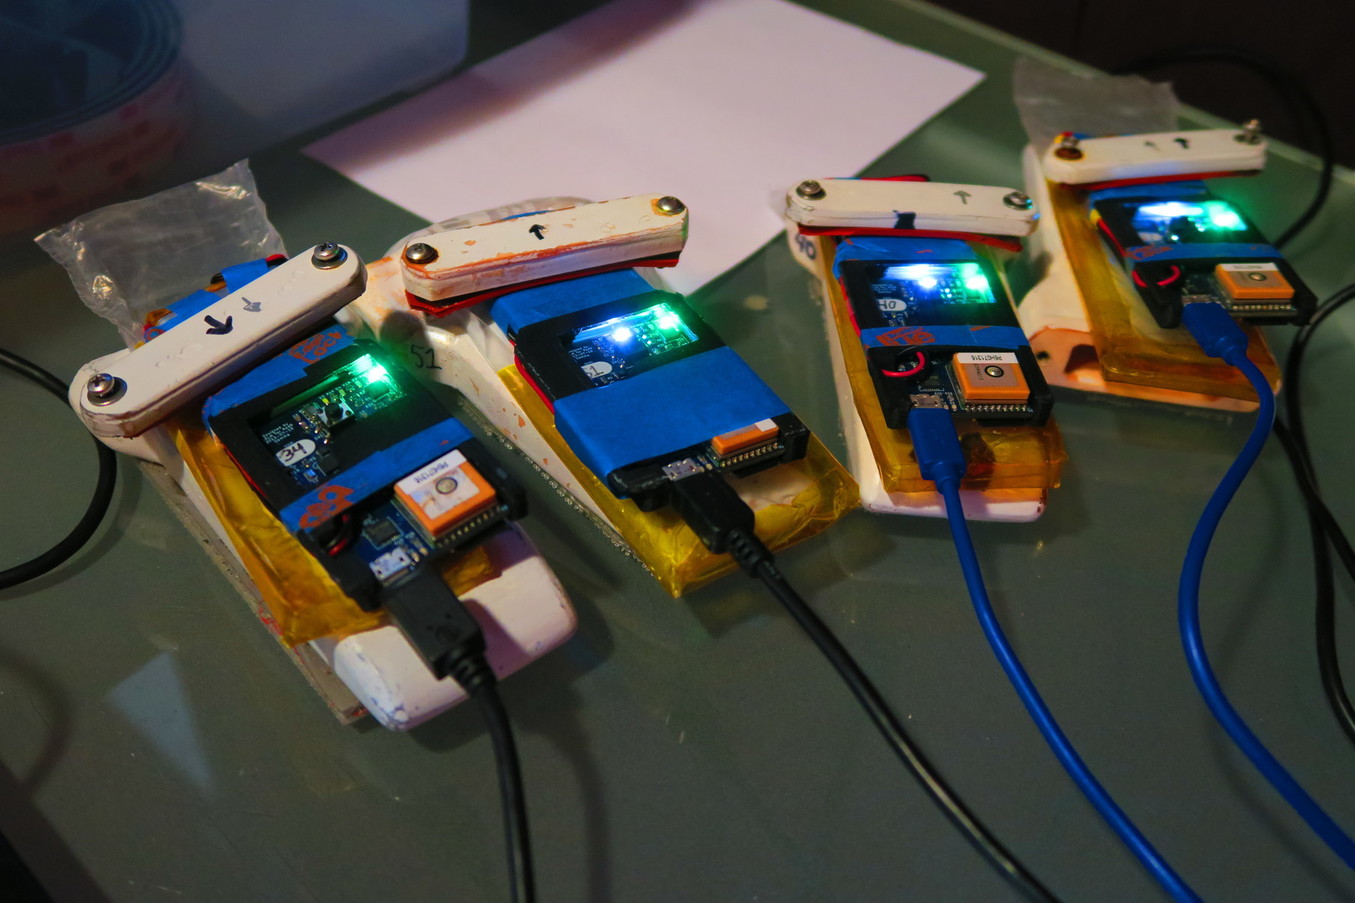
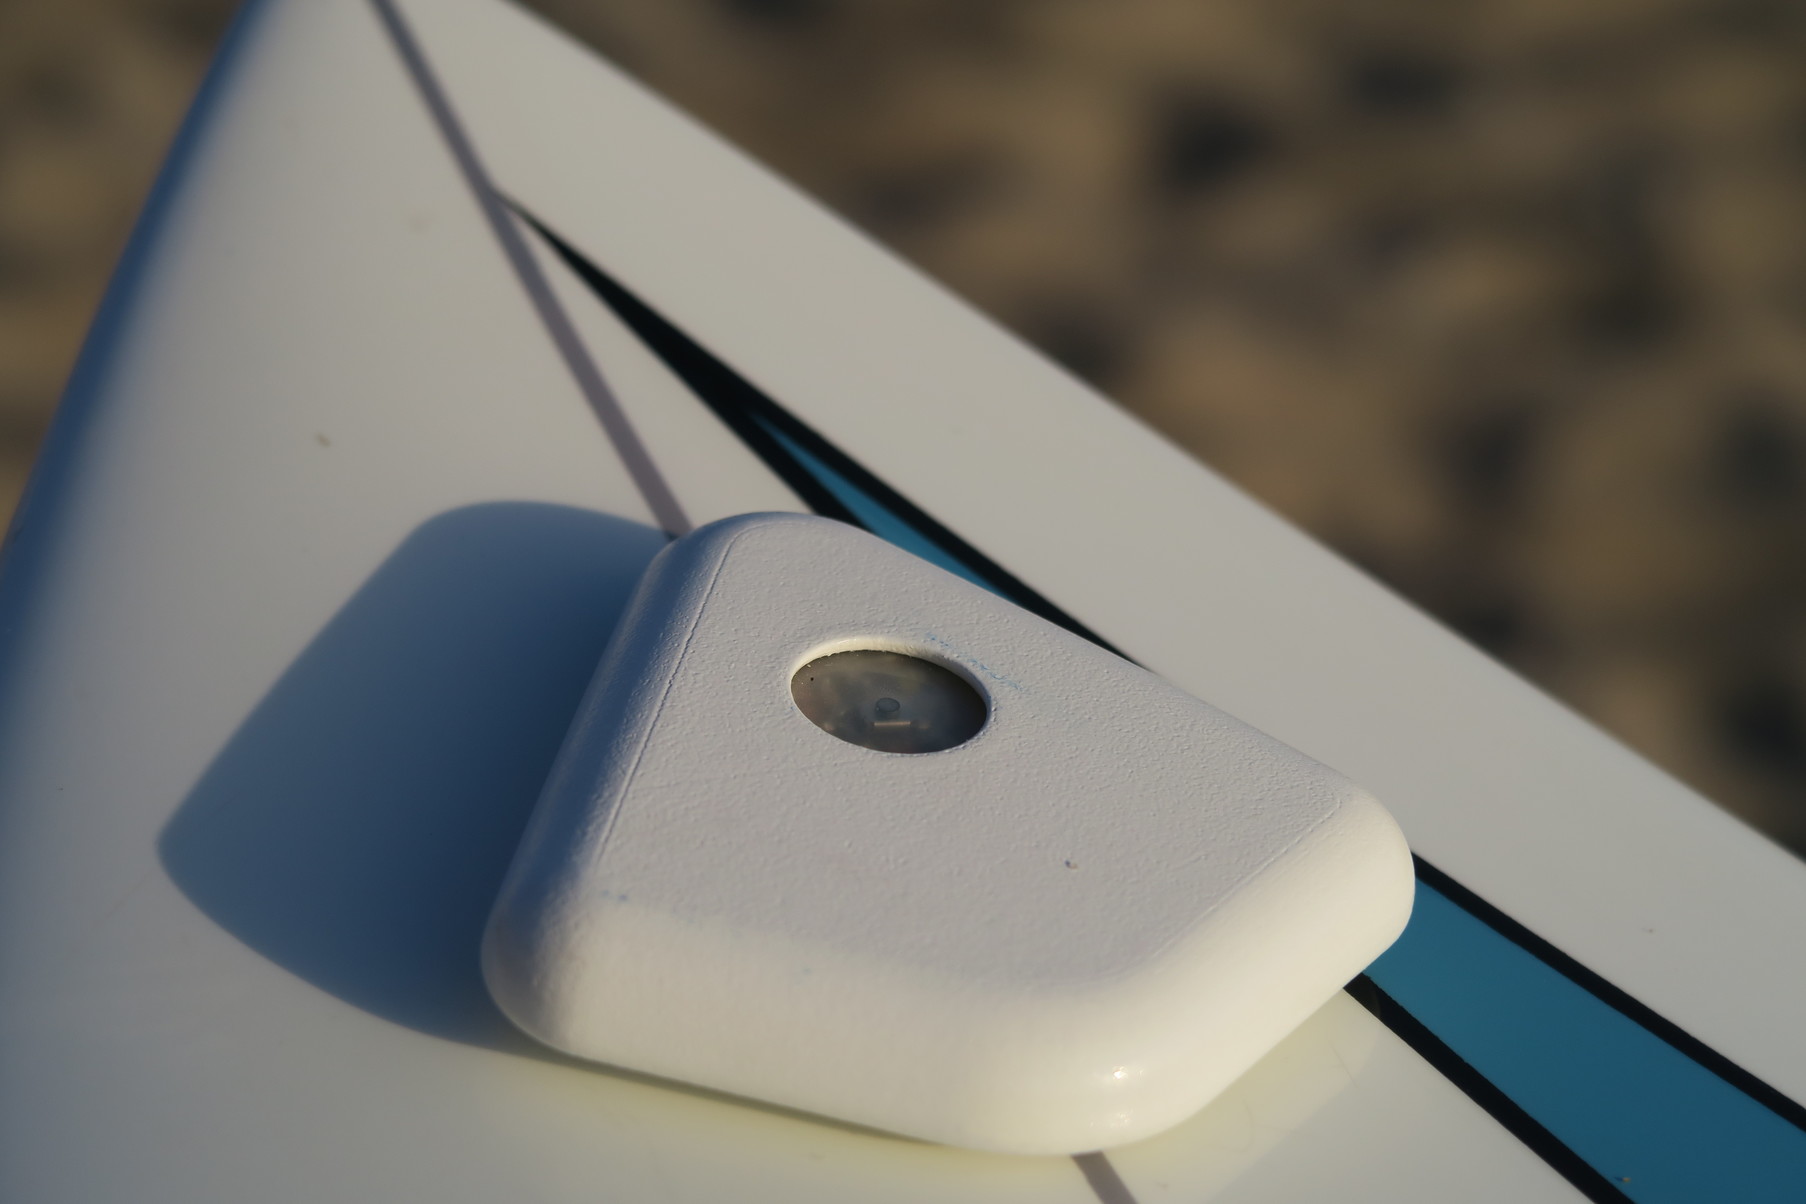
Mica took the challenge on and prototyped a bunch of different cases, trying to balance the need for ease of use, waterproofness, and aesthetics. He settled on the yellow design below, which ended up being a very reliable design. It uses a two part 3D printed case, glued and painted for water resistance, and a tight squish rubber cap to access the electronics. This case took even longer than the Gamma board assembly to manufacture.
With the hardware safely completed, I turned my attention to the processing of the data. We had a number of recorders in hand, and all sorts of interesting motion data was being recorded. Unfortunately, it was megabytes of CSV numbers that was impossible to quickly analyze and store. Initially, I built an Android app to interface and control the SCAD. As it turns out, Bluetooth can’t transfer 150Hz 15 column samples in any reasonable amount of time. Typical transfer times were on the order of 45+ minutes. So, we sidestepped the problem by plugging the recorder into a computer for data retrieval, ignored the Bluetooth connection, and turned to designing the algorithms to make sense of this data.
Each recording produces millions of points, and without a proper tool to quickly parse and display this data we were suffering. We had to recover the data off the device, run it through a program to convert the data to CSV, and then open that 100,000+ row file in Excel and graph what we were interested in. It was painful.
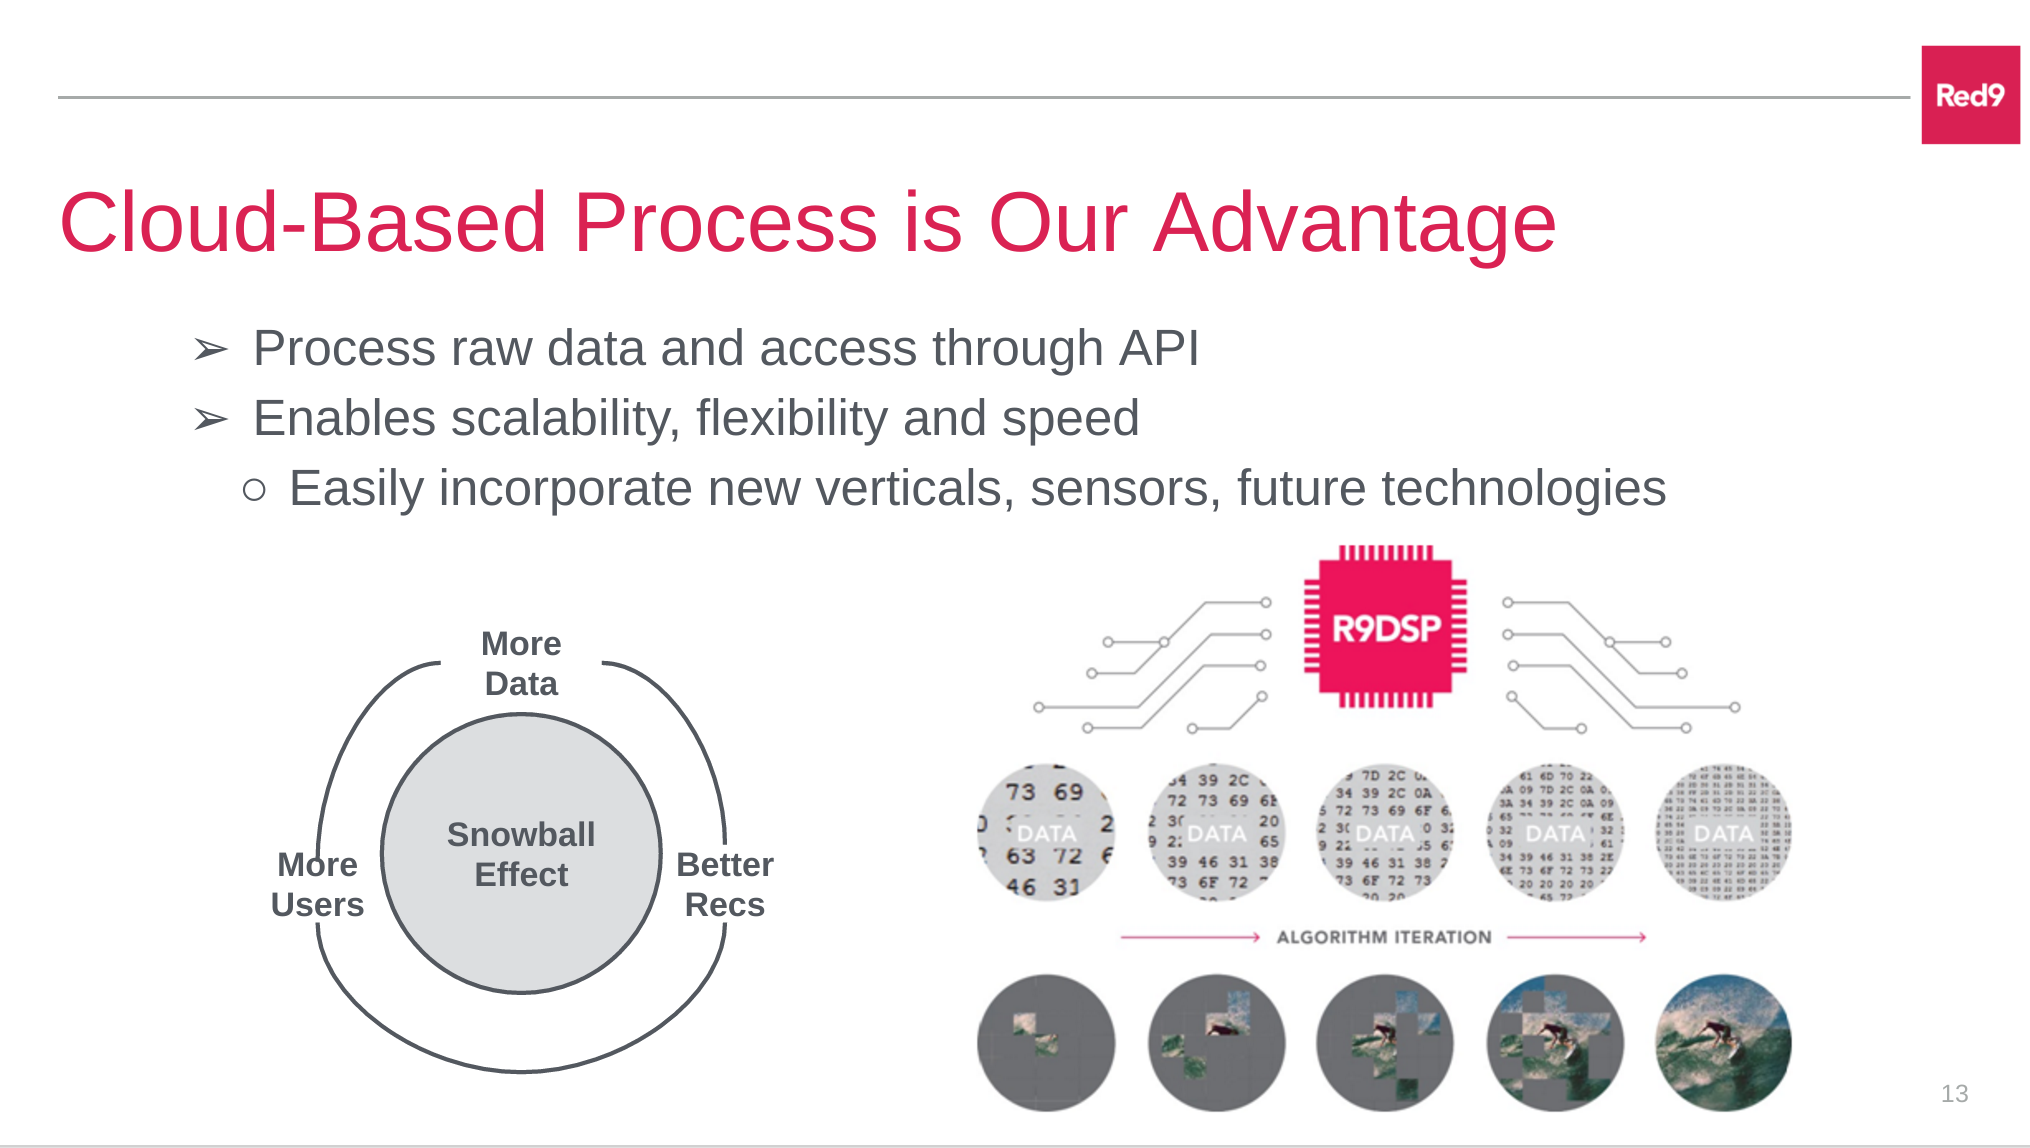
The cure for the pain was a website. For the past few months we had contracted with an independent programmer from an online contracting website, but his website (Django and some SQL database) was so slow as to be unusable. Through a series of emails it became clear that he would not or could not deliver a functioning website. In the fall of 2013, I took over and began work on what would later be termed the Red9 Data Science Platform. It’s a grand name for a simple concept: consume as many recordings as possible, make data science sense of it, and provide actionable feedback to our users.
In practice, this took form in three parts: algorithms to parse the data, an API server to store the data, and a web client to effectively display the data. I worked on the API server and web client. For the data processing we brought on my friend Akhil in the summer of 2014 and Shyama in the spring of 2015. They worked part time around their graduate studies on processing algorithms and understanding the data.
Within a month and a half, I had an initial version of the website up and running.
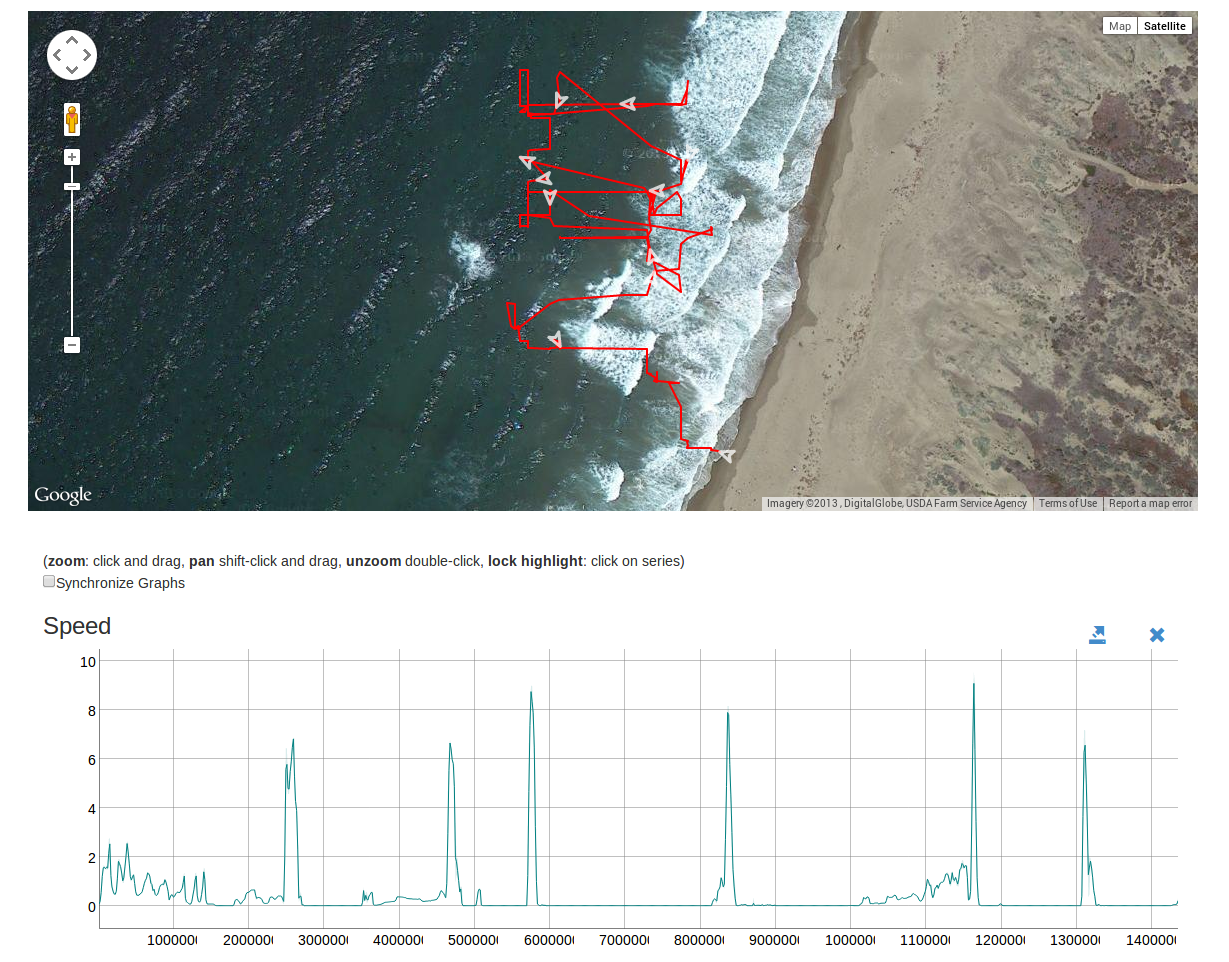
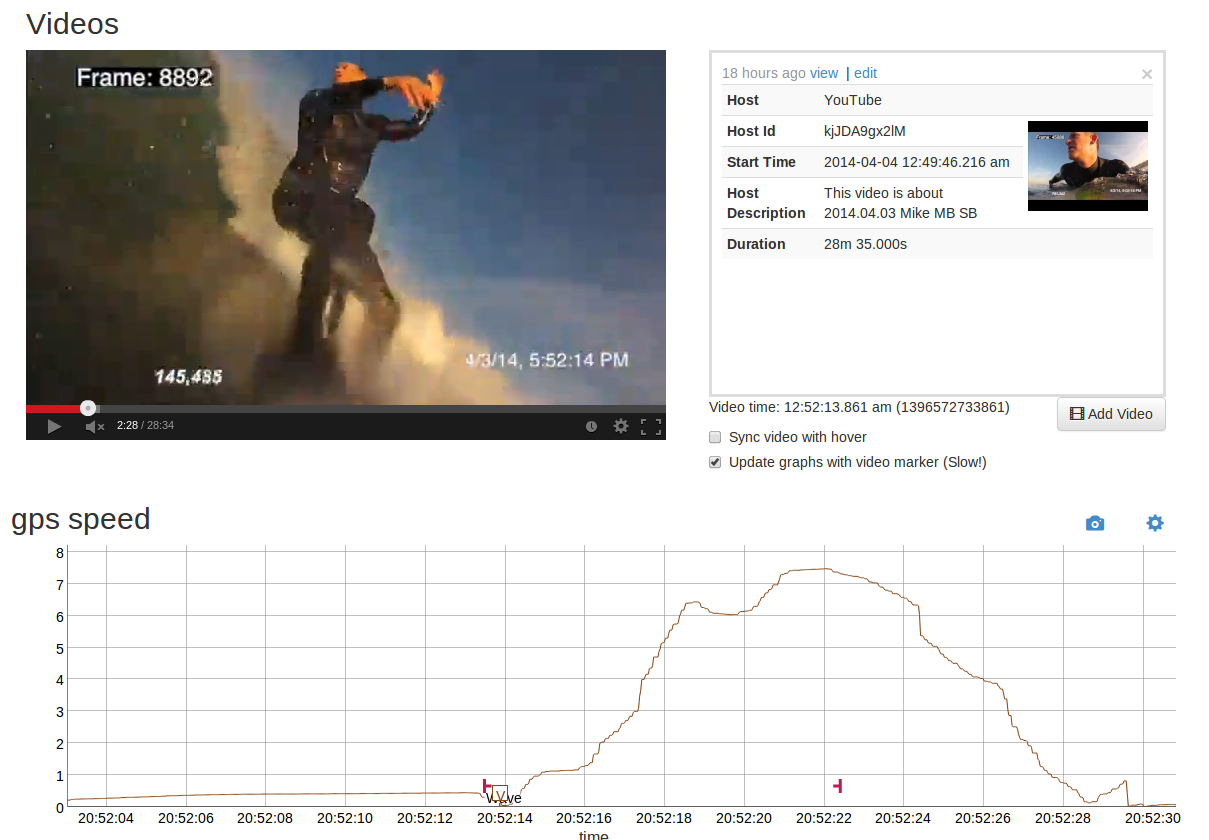
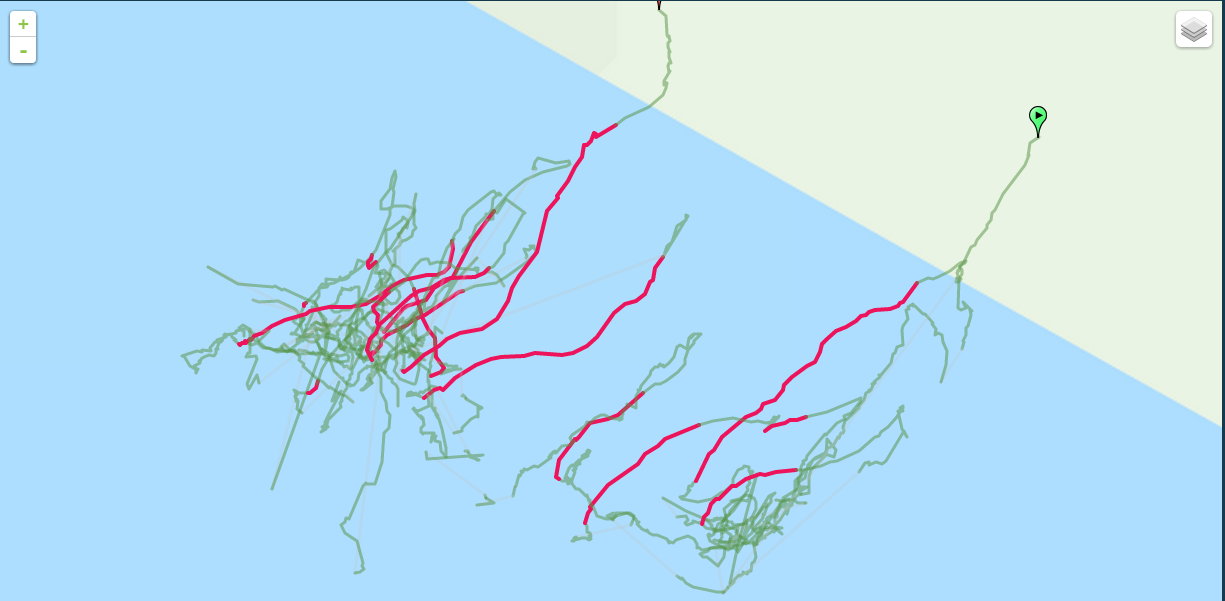
This website was pretty basic, but it revolutionized how we operated. The single feature was the ability to display the sensor data and a map, while allowing you to zoom around and keep everything synchronized. But for the first time, it was easy and fast to record a session, upload it, and explore the data.
Shortly after, I developed one of the longest lasting technical features of Red9: events. Events are how we organize the raw time series into something meaningful. An event is nothing more than a time range with a label, but that simple model is enough to break down complex motion into something that is easy to process with a myriad of data science algorithms. I didn’t know that at the beginning, though, and started with a tree model instead of simple time stamp tags.
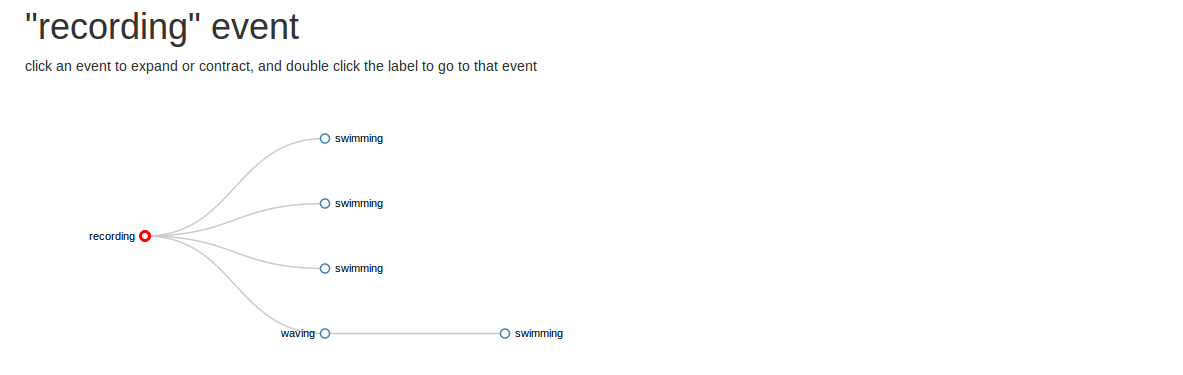
The fundamental unit of Red9 was the recording, a series of sensor measurements that would allow us to reconstruct what an athlete did. From the recording, we parsed the data to identify events of interest such as a caught wave for a surfer or a jump for a snowboarder.
The event was a very concise and handy way to annotate a recording with points of interest. Practically anything in a sport can be classified as an event. An event has three important characteristics: a start time, and end time, and a type. Events included waves, paddling, turns, jumps, duck dives (diving under a wave), and so on. What made event annotation powerful was that they were easy to create by selecting a region on a graph or generate by automated algorithm. We started out with a tree model because we thought that events were hierarchical (a turn is part of wave, which is part of a recording), but for athletics the hierarchy is implicit in the timestamps of the events, so an explicit tree data model wasn’t needed.
This first version of the website was built using a custom single page application front end framework for the client. This website was my first foray into web programming, and I was influenced by the book Single Page Applications. This book promoted developing the entire client side without a framework like Ember or Backbone. This approach gave me a good understanding of the problems and challenges of client side development, and when I switched to Angular a year later things made much more sense.
For the backend I used a combination of Node.js for the server and Cassandra for the database. Cassandra, as a database choice, was a bit ambitious. I knew from the beginning that one of our major technical problems would be our timeseries data. We collect sensor data at 150Hz, and when stored to disk in a table format a single hour of surfing can easily stretch into the 100s of MB. Add several hours, multiple users, and the scale of the data can get pretty big.
Cassandra is a database out of Facebook, and is designed for massive parallel data. This NoSQL database work really well for storing timeseries data, but it falls apart when you try to add metadata. Every recording has this associated metadata that must be arbitrarily searchable, and that’s exactly what Cassandra is not good at. To extend the query capabilities I wrote a MongoDB API layer that translated and executed Mongo queries into Cassandra. I ended up switching from Cassandra after a year when I got frustrated with the limited query capabilities. Cassandra was, however, a delightful database to work with from the operations side.
The first big jump for the new website was adding video sync in April 2014. Video allowed us to record a session, and then go back and examine the data in very fine detail and see exactly what the athlete did to generate the data that we were seeing. This made it easier for Akhil and Shyama to better understand the data of surfing.
At this point we felt that we had a pretty good idea going, and shifted the company focus from technical development to business development. This was motivated both by the relative maturity of our technology and by the increasing expenses. We were completely self funded through a series of rounds, mostly from the two founders Mike and Mica. Roughly 75% of our money went to salaries for myself, Akhil, and Shyama. While everyone else was part time, I was able to work full time on Red9.
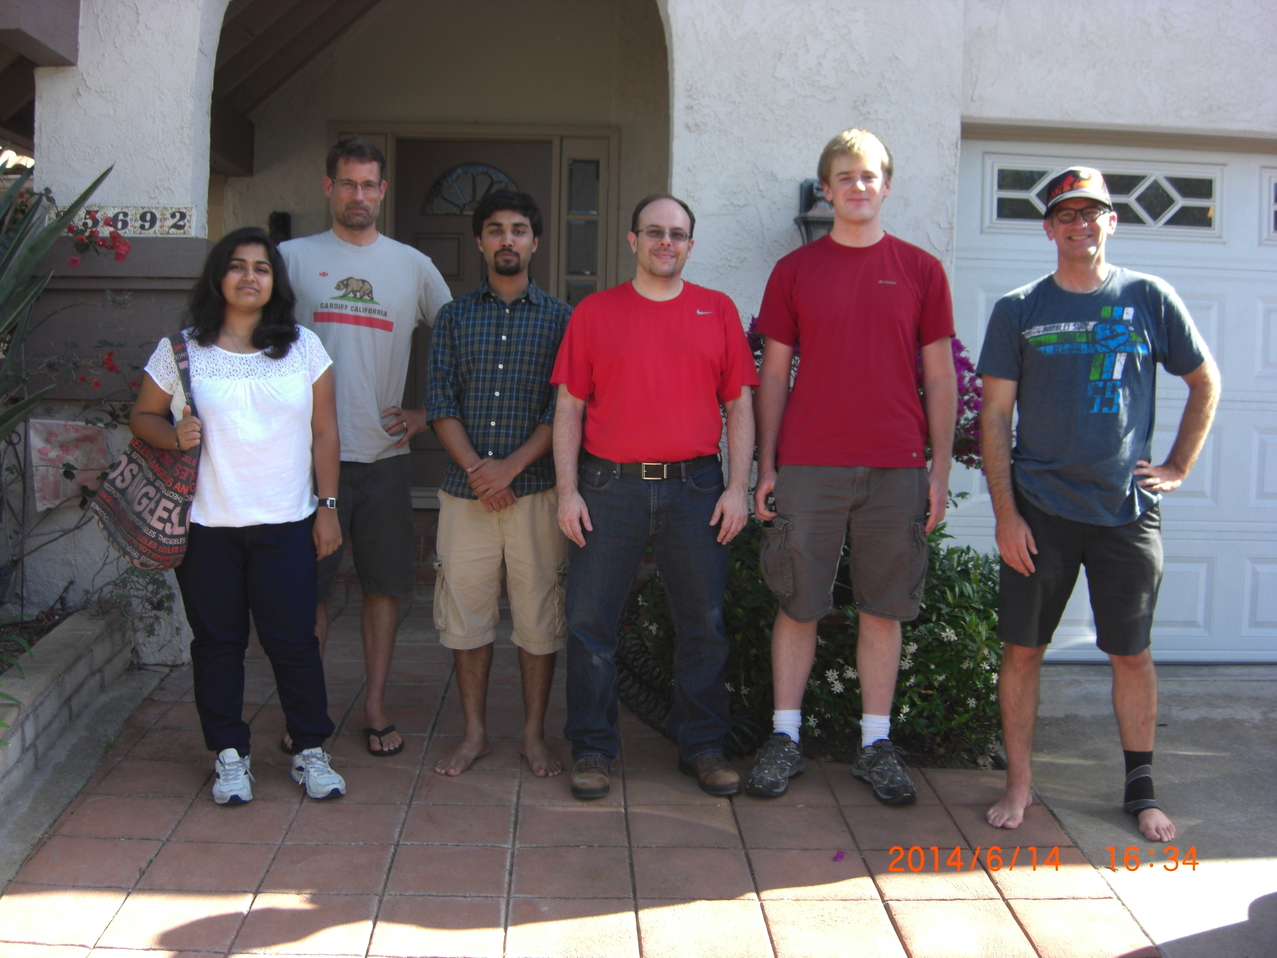
Here we are, at the one and only Red9 Global Summit. Over the next few years we would move into 4 different timezones, add people, and never meet together again. From left to right: Shyama, Jeff, Akhil, Mica, Cody, and Mike. This was also before we had official Red9 shirts; Mica and I tried anyways.
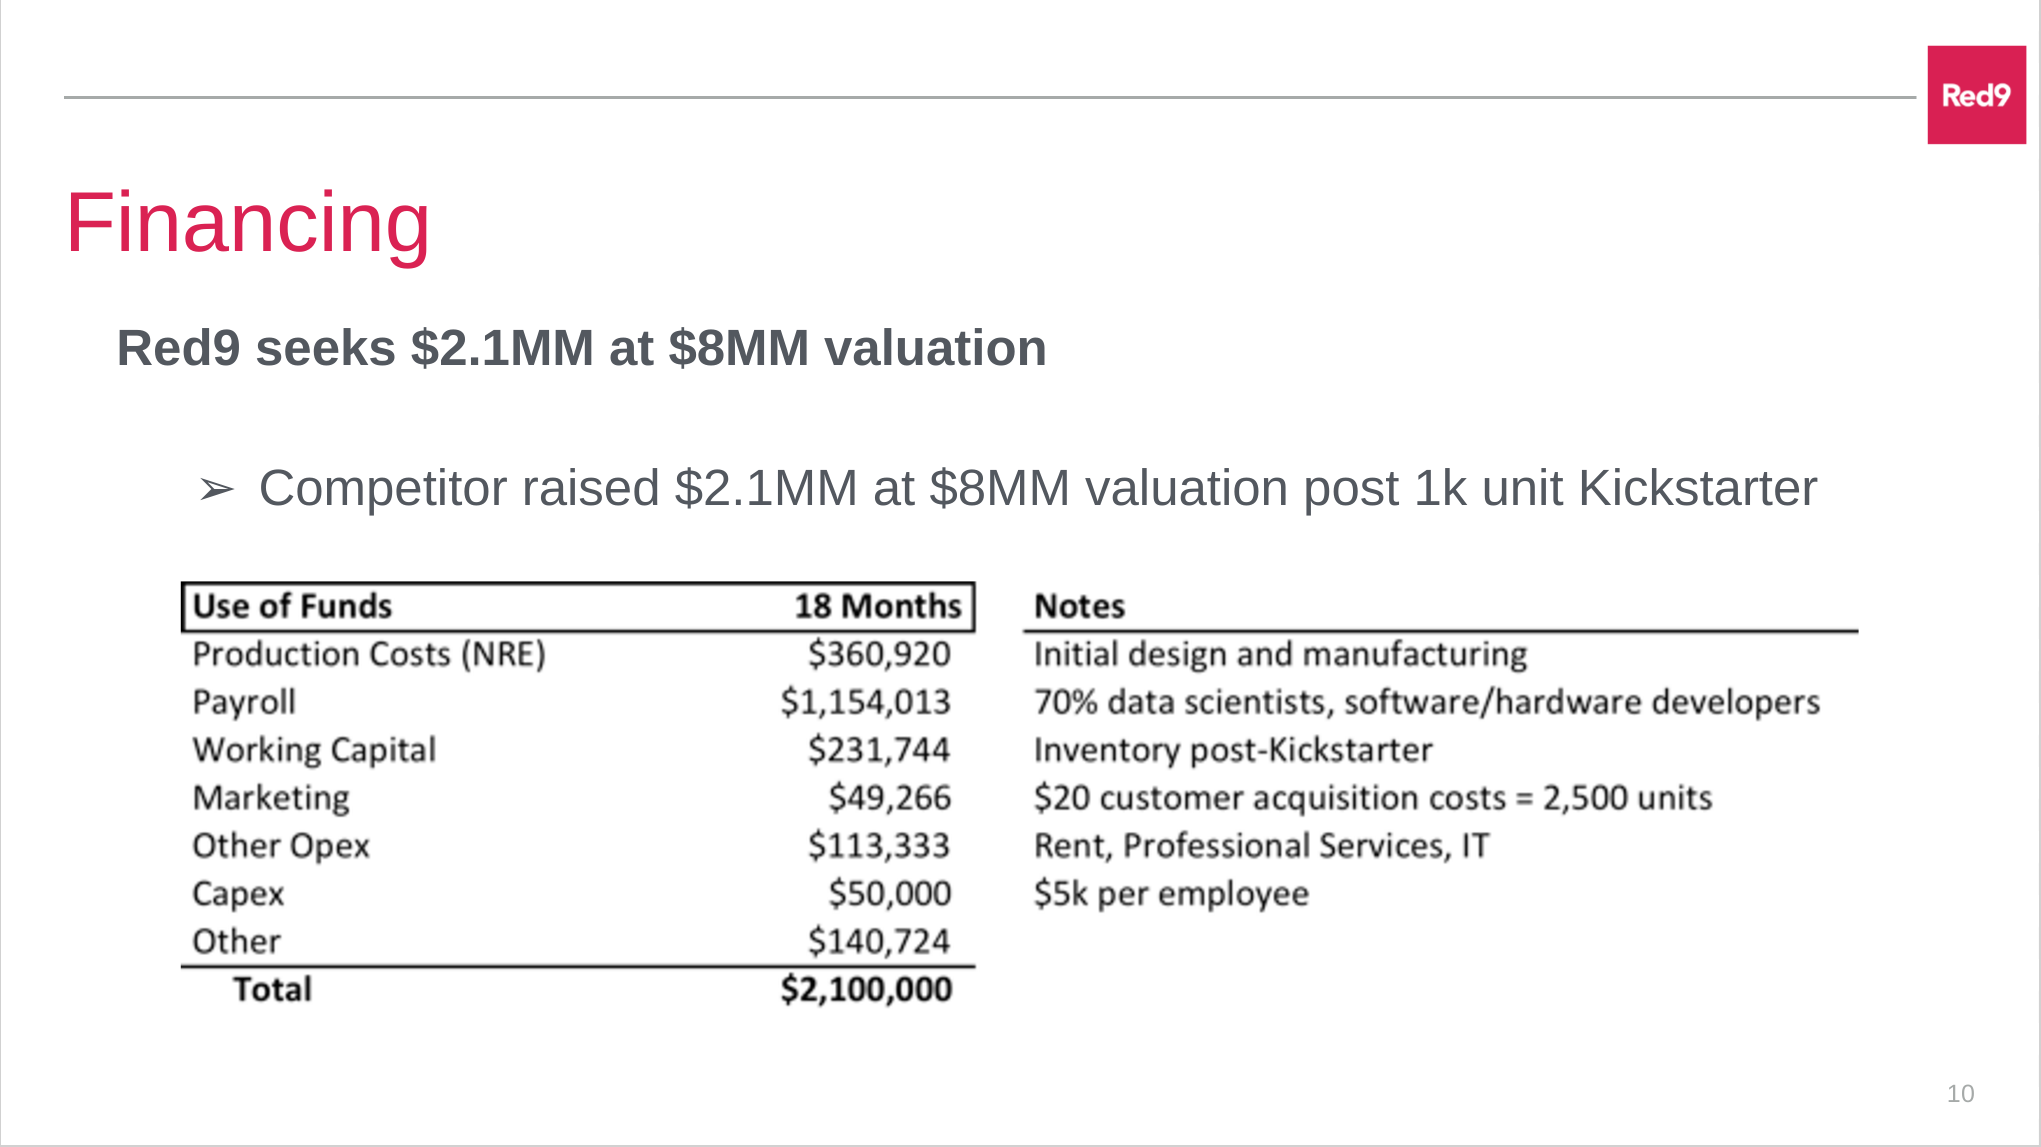
In early summer 2014 we brought on Jaysen to help Mike deal with the business side of things. We made projections, glossy pitch decks, and company goals. The technical team continued to work on improving the technology and developing a machine learning framework for surfing analysis, along with tweaking the website to be more presentable to investors.
Our hope was to achieve some sort of Kickstarter and VC funding amalgam. We figured that if we could get on Kickstarter then people would jump to fund our campaign, to the point where we’d quickly raise a few hundred thousand dollars. After that investors couldn’t help but back the “market validated” team and product and we’d be able to launch a company. Or maybe we could skip Kickstarter and be able to just reach investors directly. We tried it both ways in an attempt to raise awareness and get outside investment.
The website at this time was suffering from growing pains. Using a custom client side framework was difficult to maintain and extend, Cassandra as a database option was difficult to extend to flexible data models, and Express/Connect on the Node.js wasn’t as powerful as I would have liked.
I ended up redesigning the website in two phases. The first phase was the backend, where I switched to HapiJS and PostgreSQL. PostgreSQL gave us the searching and storage needs that we wanted for our metadata, but it doesn’t handle 150Hz 15 element timeseries very well. For that I developed a custom binary format, along with a Java and later C++ parser that parsed the binary in real time in response to API calls. Despite the pretty intense data requirements, most requests completed in a few seconds, and some (such as zooming on graphs) were responsive enough to not be an issue.
For the client side I switched from my custom framework to AngularJS. While challenging to learn at first, Angular is very powerful and with it I was able to do some pretty cool data analysis pages. My favorite page was the graphs page. For each recording, it displayed all our sensor data on a single page, synchronized and fully responsive across each sensor, axis, map, event timeline, and video container. By the end of Red9 I had developed a number of custom data display elements that helped highlight the unique features of our data.
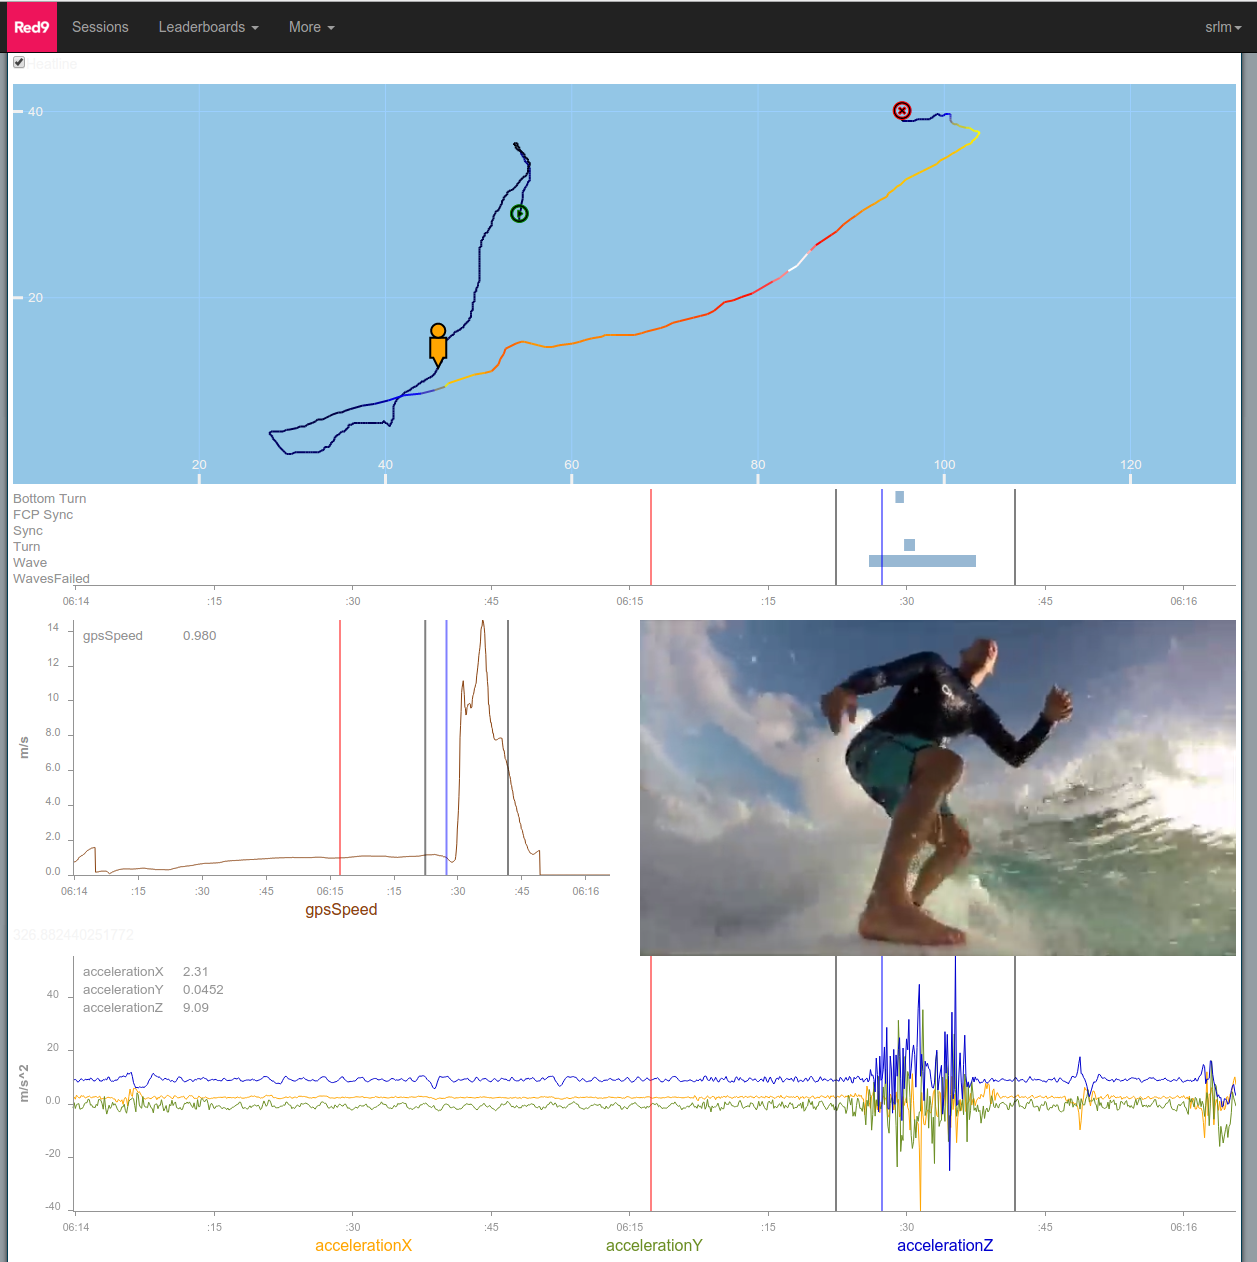
Despite the rough layout of this early design, this page was the heart of our data science exploration. The top visualization is a heat line map. Developed using SVG and Angular (a very underappreciated combination!), this map shows a variable as a heat color along the path of the athlete.
The second from the top visualization is an event timeline, which displays all the events for a recording. Here we’re zoomed in on a few minutes of data, which is why there is only one wave.
The next two rows graph some of the more interesting variables, speed and acceleration, along with displaying the video. All five visualizations are synced. If you play the video, you see the timeline bar moving on the graphs and the yellow peg moving on the map. If you hover over the graphs, the video, red bars, and yellow peg all sync so that you can quickly explore correlations in the data.
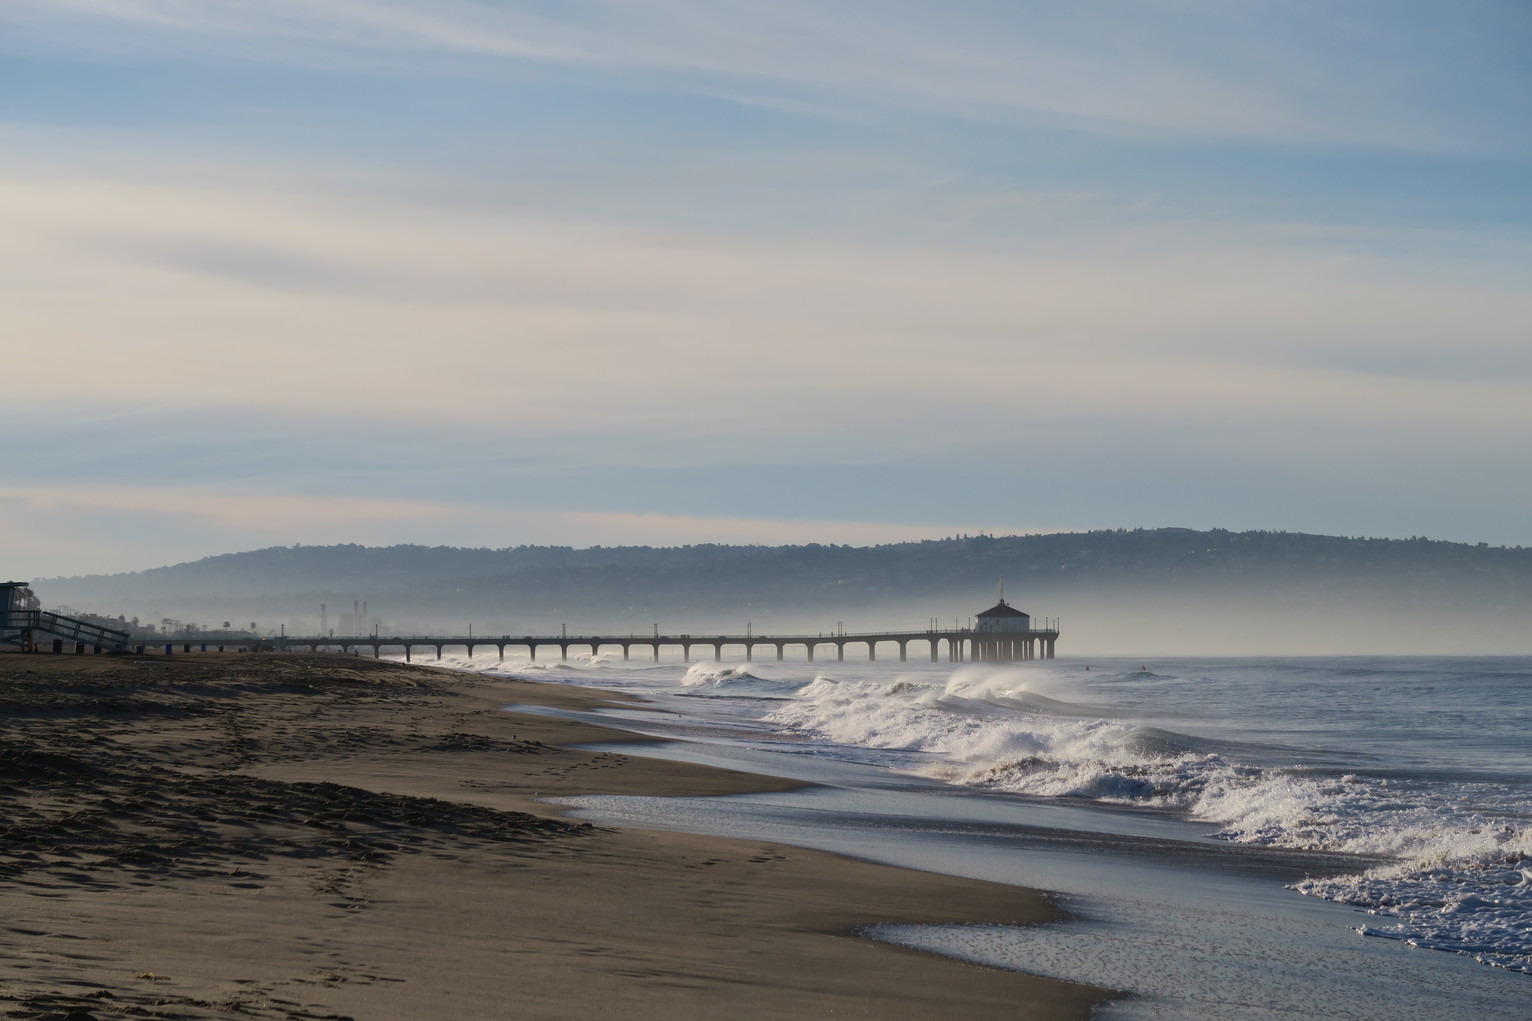
As the end of autumn 2014 rolled around, we started stagnating. Akhil needed more surfing data from multiple riders for the data analysis, and our two surfers Mike and Jeff were pretty busy. To speed things up and collect some market research I booked a ticket to California and spent a month in Manhattan Beach working with a local high school coach, Tracy. The deal was we’d instrument some of his athletes every day and film them from the beach. The team would get some interesting data and video and we’d get a wide range of skills from a large selection of people.
As I discovered, surfing required getting up incredibly early for the reward of some really nice sunrises and some pretty cool data.
In the early mornings I was out with the team, trying to catch them with the camera when they caught a wave. In the late mornings I wandered up and down the beach, and tried to get random surfers to use the device. And in the afternoons I’d process the data and send out emails. Our website was invaluable for this. With an improved wave finding algorithm from Shyama Mike and I were able to semi-automatically edit the camera footage with remarkable accuracy.
This user testing revealed a few things about our product. The first was that most people, especially the kids, were excited to be using some sort of tracker to make their surfing better. But none of us were really sure what we wanted to see, beyond the basics of ride tracking and paddling data. The second thing that this test revealed was that the device had a long way to go to be more discreet, robust, and produce better data.
Mike, Jaysen, and Jeff continued to refine what Red9 was as a company, and what our value proposition was for the user. They worked with Juan, a video producer, to make this teaser for Red9:
Red9: Every Move Counts from Red9 on Vimeo.
Mike and the rest of team were working hard to try and raise VC funding for Red9 by developing the business aspects of Red9. They worked on trying to refine what the Kickstarter campaign would look like. At this time, due to a new member of his family, Mike decided that he was not able to contribute as much as Red9 needed. He brought on Ben to replace him as CEO while Mike stayed on as Founder.
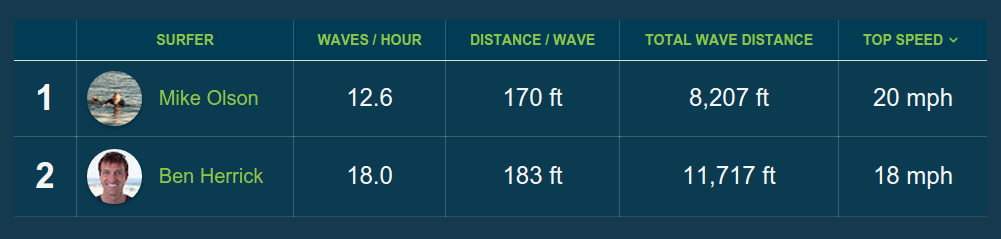
One idea to make the data more interesting was to do a “leaderboard”, where stats could be collected and surfers could compete for first place. Unfortunately, due to the limited number of recorders and proficient surfers, only Mike and Ben were ever able to get enough sessions to make interesting leaderboards.
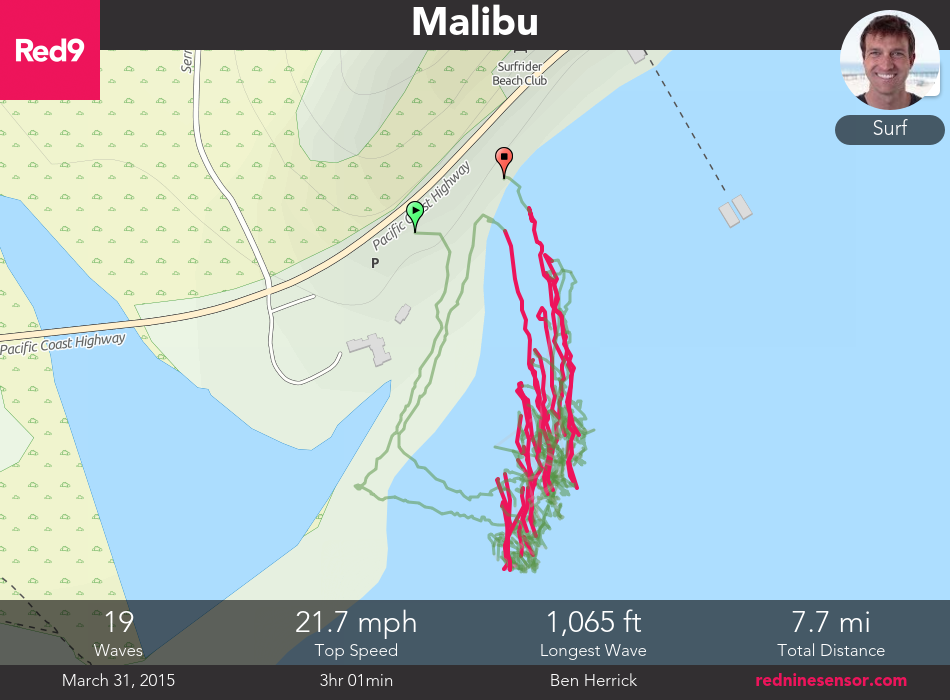
On the technical side of the company I switched into making the website look better, perform better, and have more user friendly features to make a minimum viable product (MVP). Ben and I developed the session sheet shareable image as a quick way of sharing a surfing snapshot on social media.
And I tweaked the website to be more surfing focused and more design oriented:
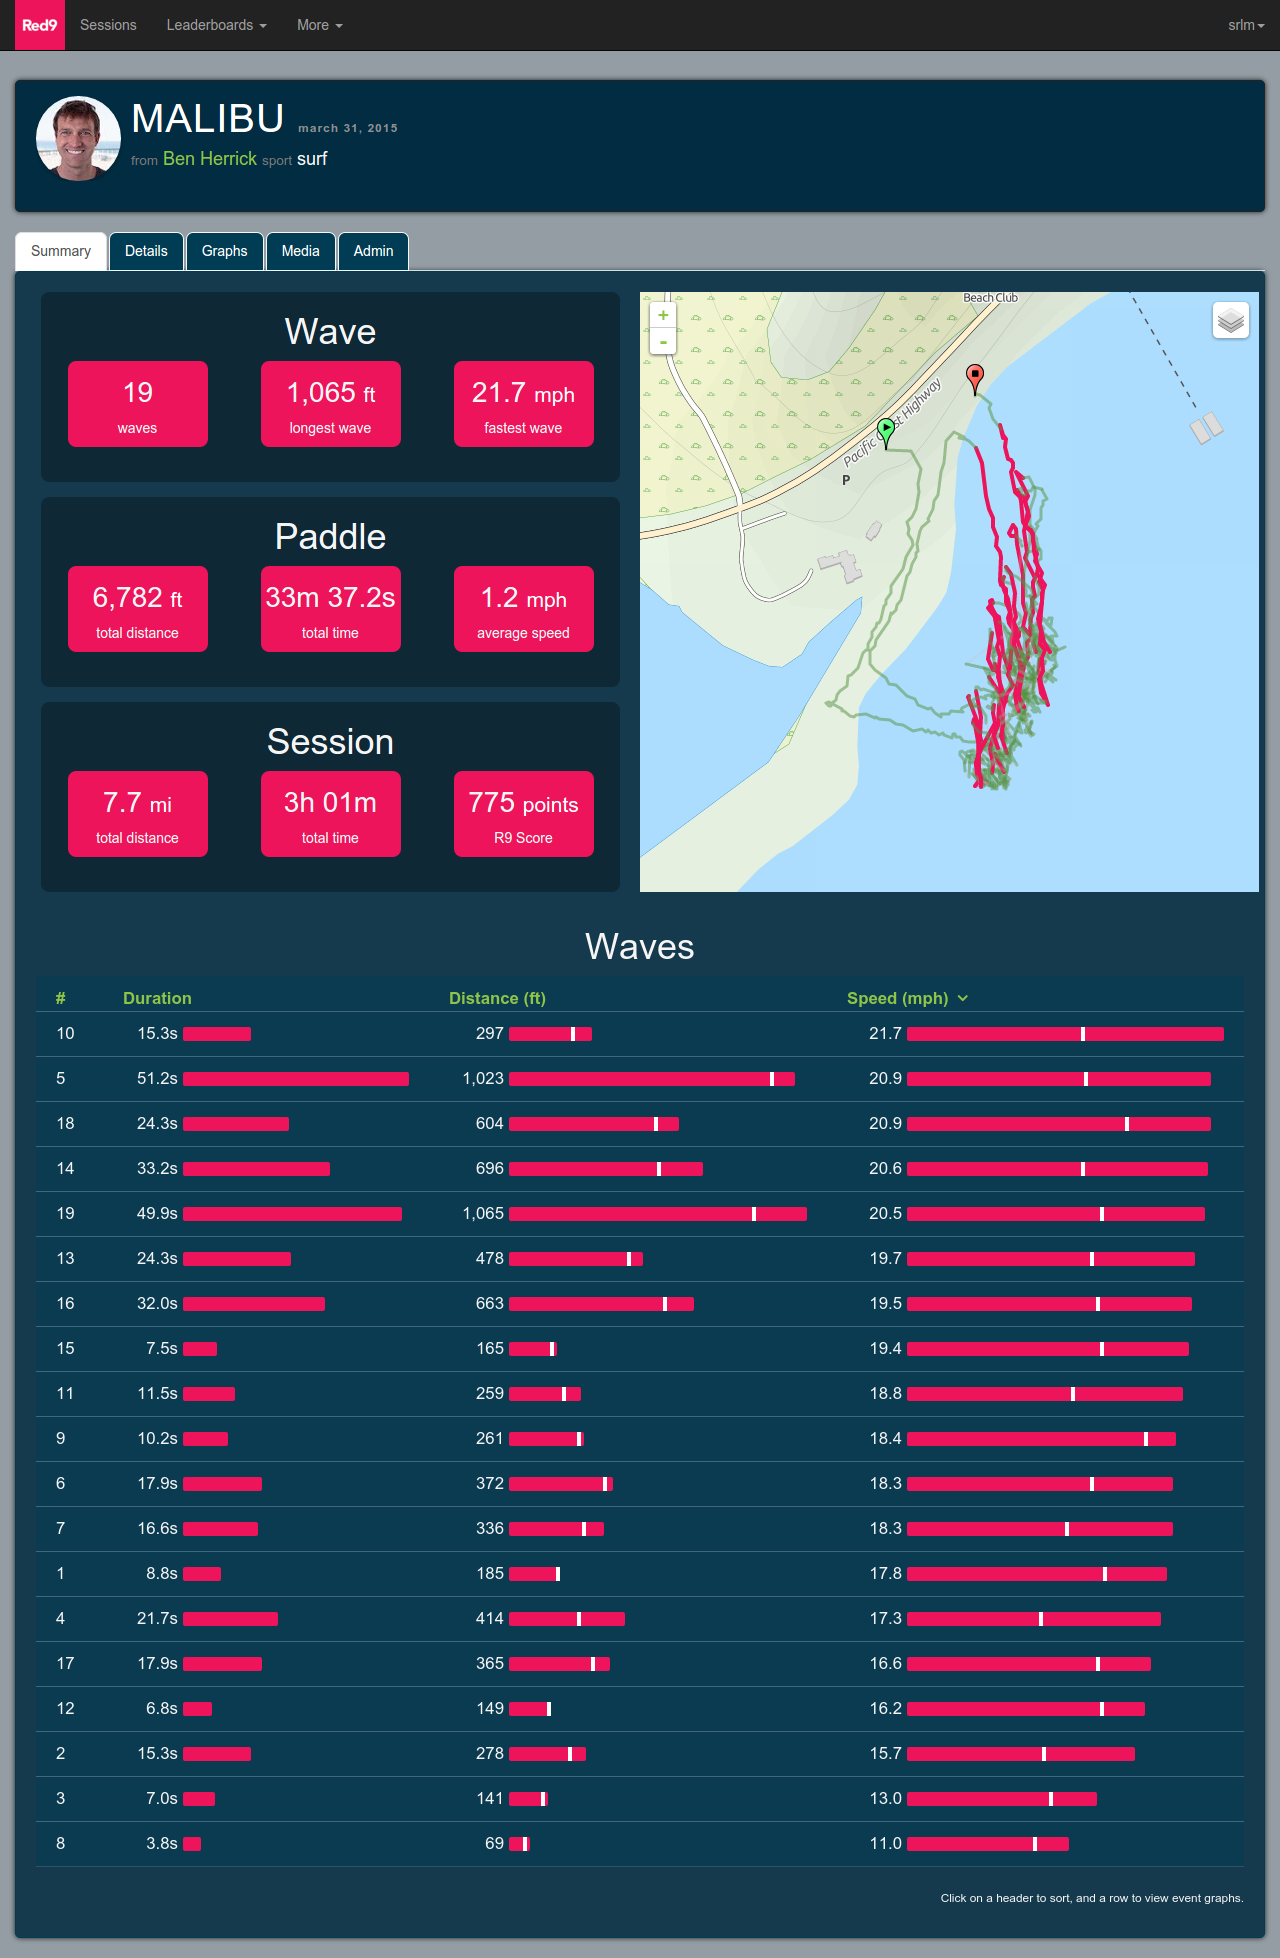
We thought it looked pretty good. I particularly like the bullet graphs. All the wave data was automatically generated from parsing the raw data using Shyama’s algorithm, and then the server generates some additional session statistics.
Finally, I made searching and browsing easier.
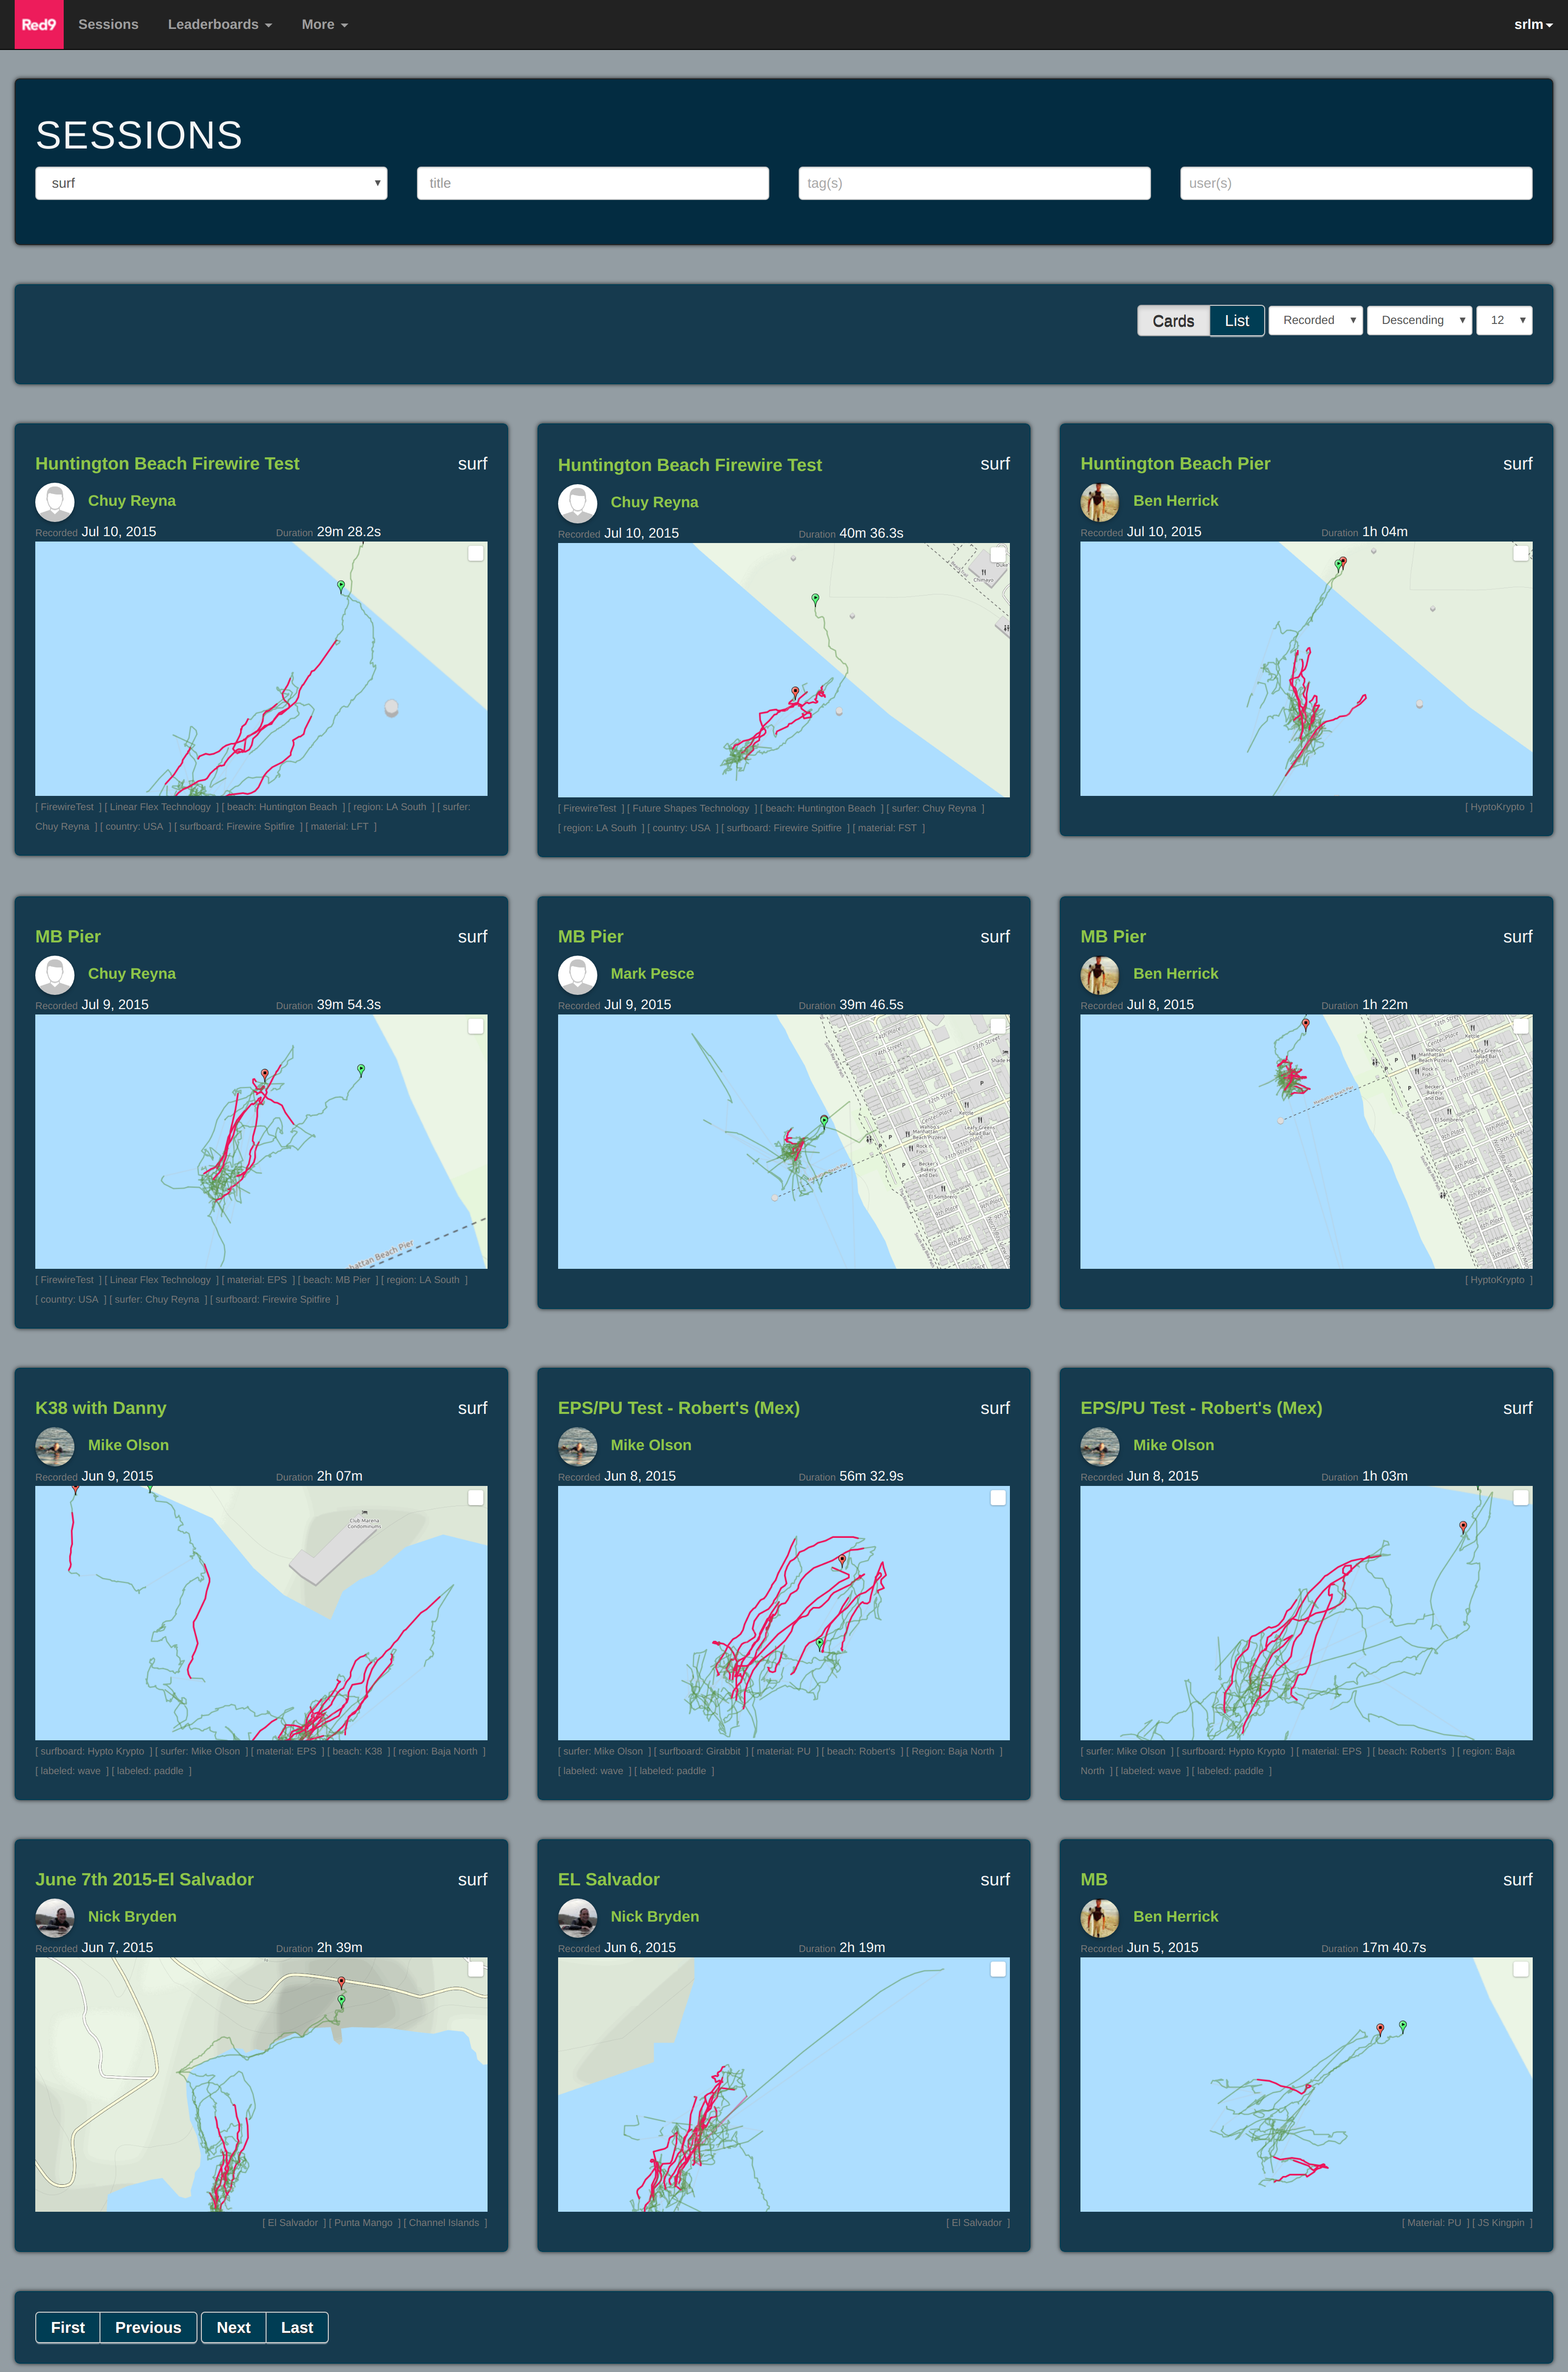
At this point, the technical data website was feature complete, looked good, and was at the point where developing new features would have required a full time technical team that we didn’t have the money or time for. Eventually, all the website code made it onto GitHub in the a backend repository and a frontend repository. We did need a small marketing website to help launch kickstarter, so this is what I worked on next.
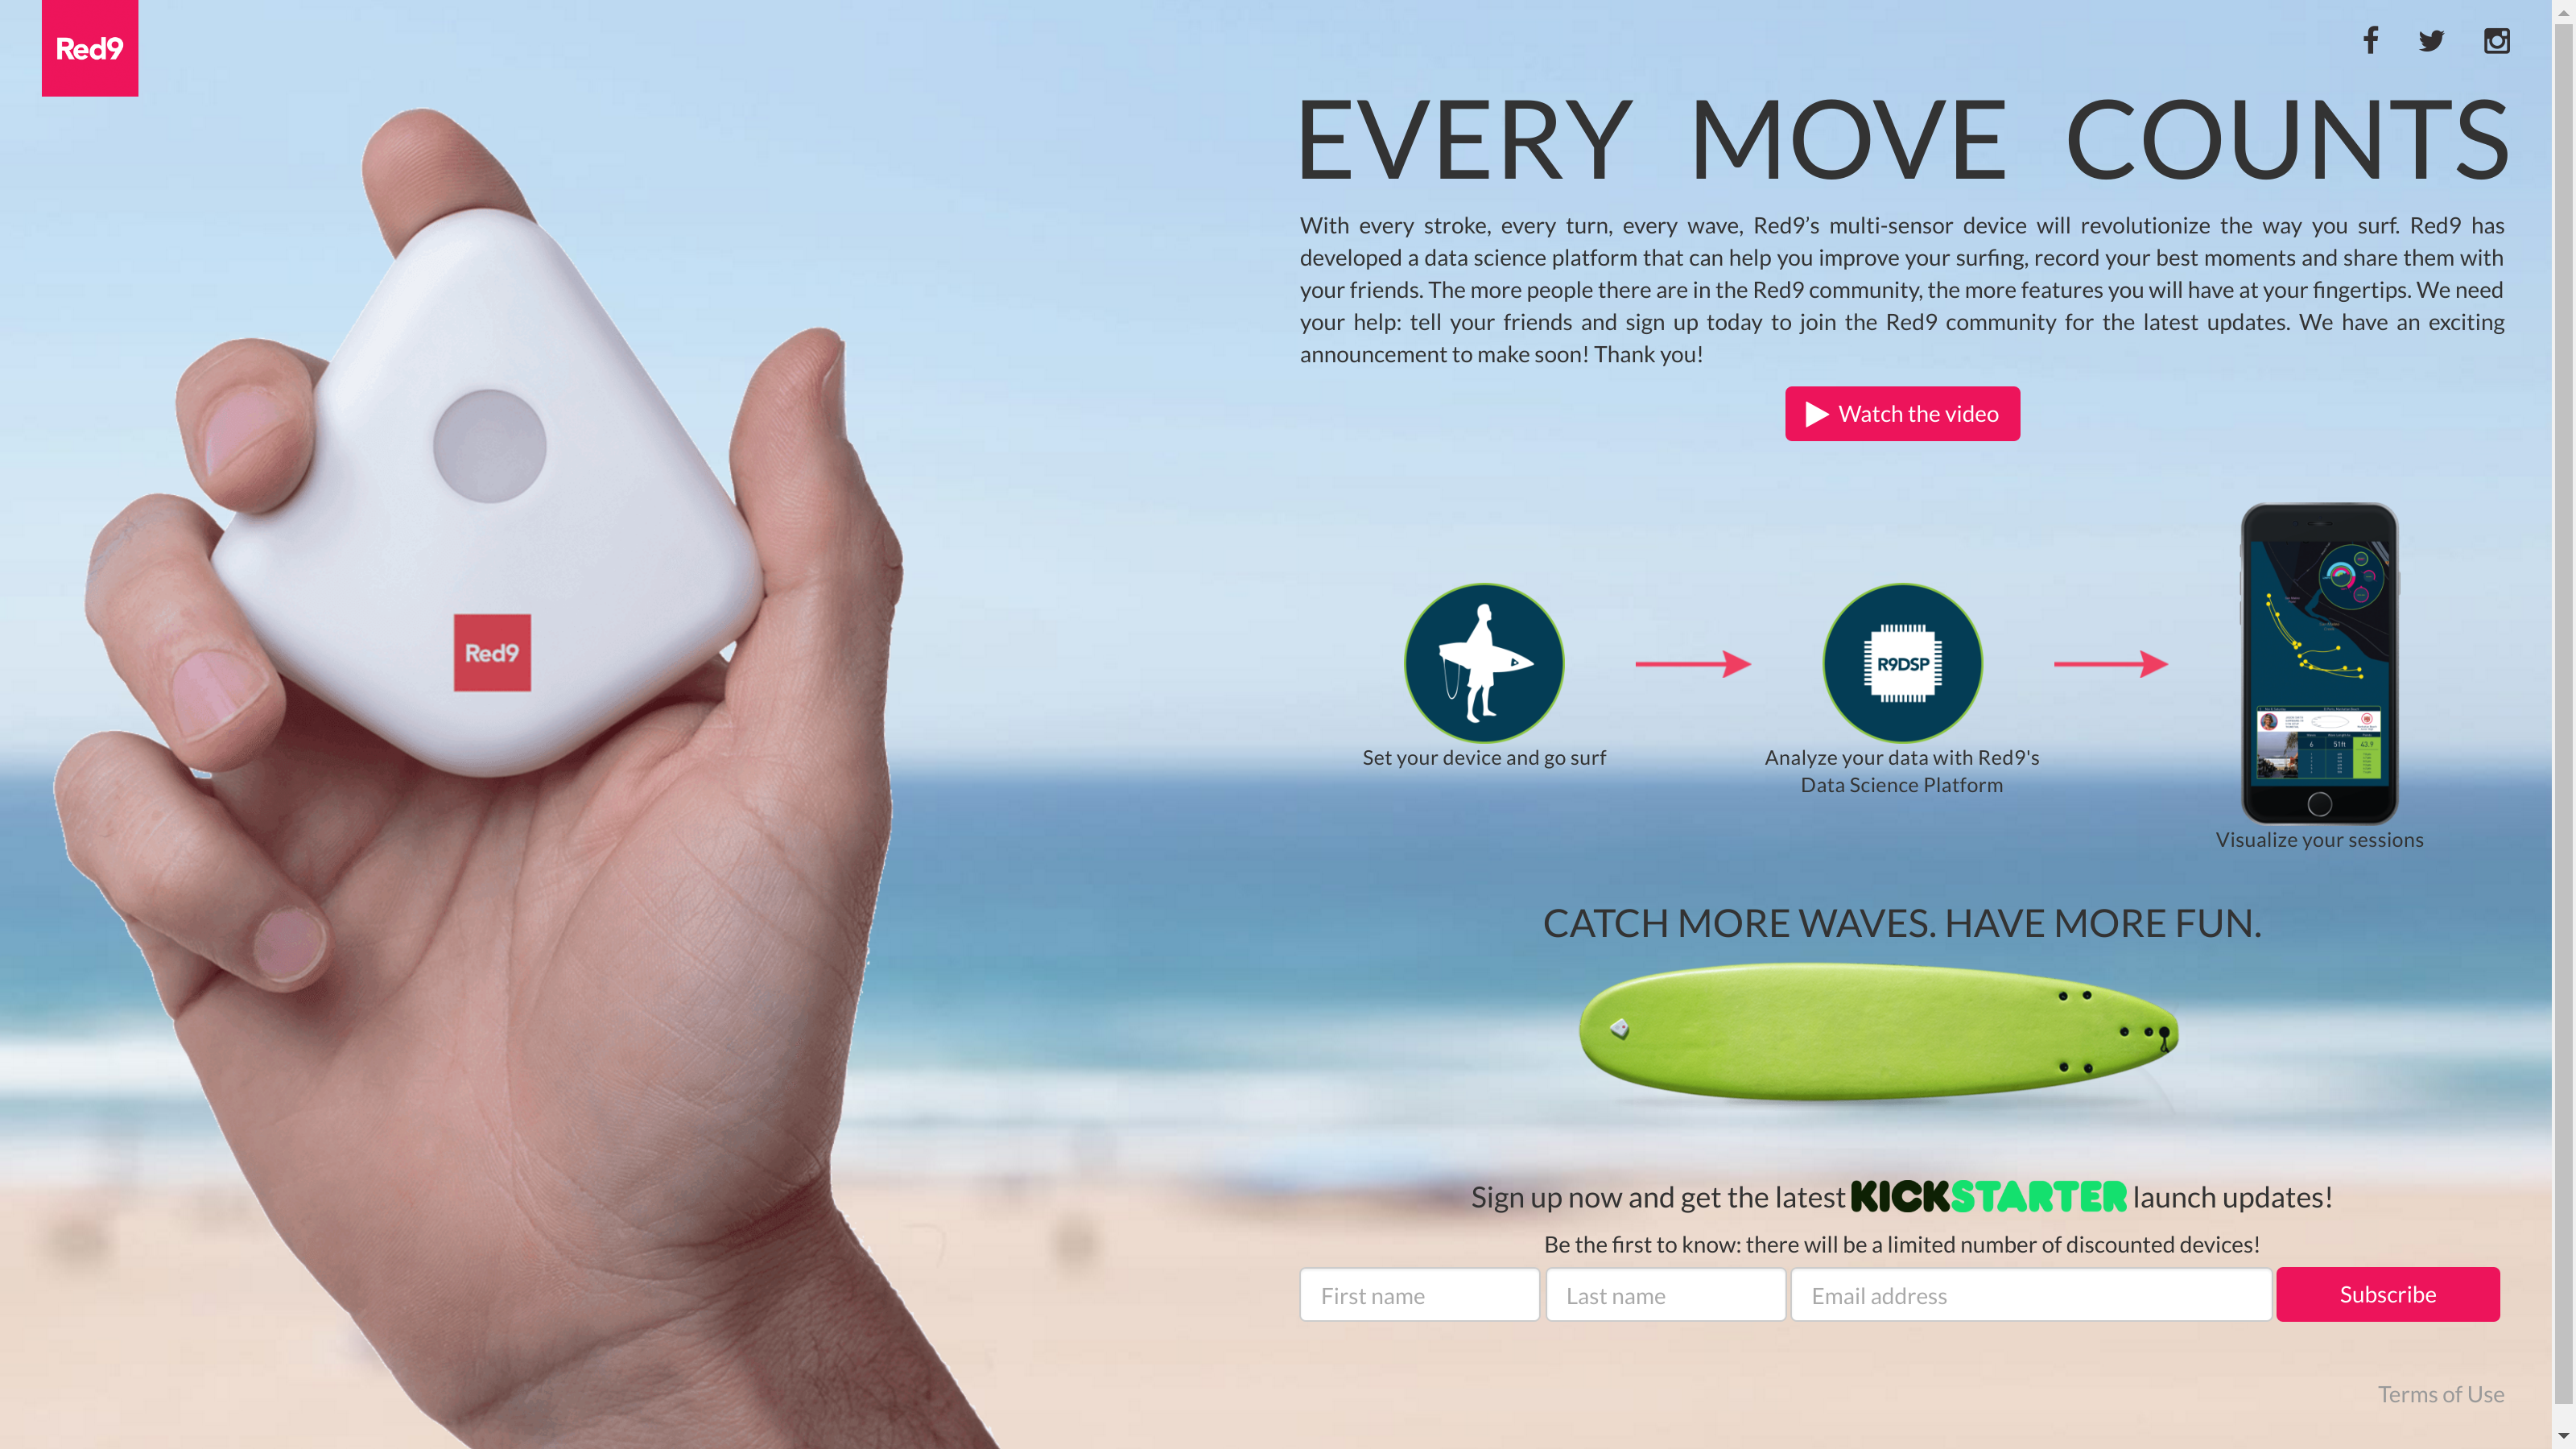
For the marketing website, I took a one page teaser image developed by our marketing guy, and turned that into a responsive web page. It’s not a complex page, but I was quite pleased with the responsive layout. I used S3 static website hosting for this (and the data website client, incidentally).
Our business team (Ben, Jaysen, Mike, and Jeff) were hard at work developing pitch decks, kickstarter material, and everything else needed to get us funding. We even got a shared article in the LA Times, “Techies who surf are stoked about Silicon Beach club”.
 |
 |
|---|---|
 |
 |
Through spring and into summer of 2015 fundraising continued unsuccessfully. It became more and more apparent that we were not going to get any VC money. They hardly wanted to talk to us. Was it because we were a 3 year old company without a track record? Was it because of a fatal flaw? I don’t know, but it was hard to keep working as it became more and more apparent that we were not going to get funding.
In the summer of 2015, after considering that Red9 was no longer recoverable, I decided to join Formlabs as a Manufacturing Software Engineer.
Failure Analysis
Why didn’t Red9 succeed? I think there are two reasons:
We choose the wrong sport.
We weren’t committed.
Surfing was the passion of Mike, Jeff, Jaysen, and Ben. The technical team, in particular, didn’t surf, but it seemed like an interesting problem. We made surfing our breakout sport, and once we had mastered it Red9 would expand into different verticals. Unfortunately, getting started in surfing was one choice that we never, ever questioned (myself included).
Instead of surfing we should have started with ski and snowboarding. Snow is much more approachable for data analysis and for the business:
- Surfing is a one sided market: only surfers would buy our product. In contrast, with snow both the athlete and the resort are interested in the data and willing to pay for access.
- Snow has resorts, which are both a market for recorded data and a potential partner to sell, rent, or otherwise distribute recorders.
- Processing surfing data is much more difficult than snow, and there’s much less interesting data to capture. This is a big one, because it defines the amount of value that you can deliver to a customer. A surfer can easily count caught waves, but a skier can’t count his vertical drop.
- Surfing is decentralized in both communication and space. There is no one source that all surfers check, and no one place that surfers congregate (no resorts). In fact, surfers are fiercely territorial and will resist outsiders. This makes it hard to market and spread the word about a new surfing product. Snow, on the other hand, has a finite number of resorts and a strong network of ski shops.
- For Red9 in particular, none of the technical team were interested in surfing (I’m addicted to snowboarding). This means that as we we’re developing features we don’t have any intuition about the data from experience, and we’re intrinsically less motivated because we can’t use the feature.
- The physical requirements of a surf device (small, lightweight, waterproof, inconspicuous) are much more demanding than snow (attaches to board or fits in pocket).
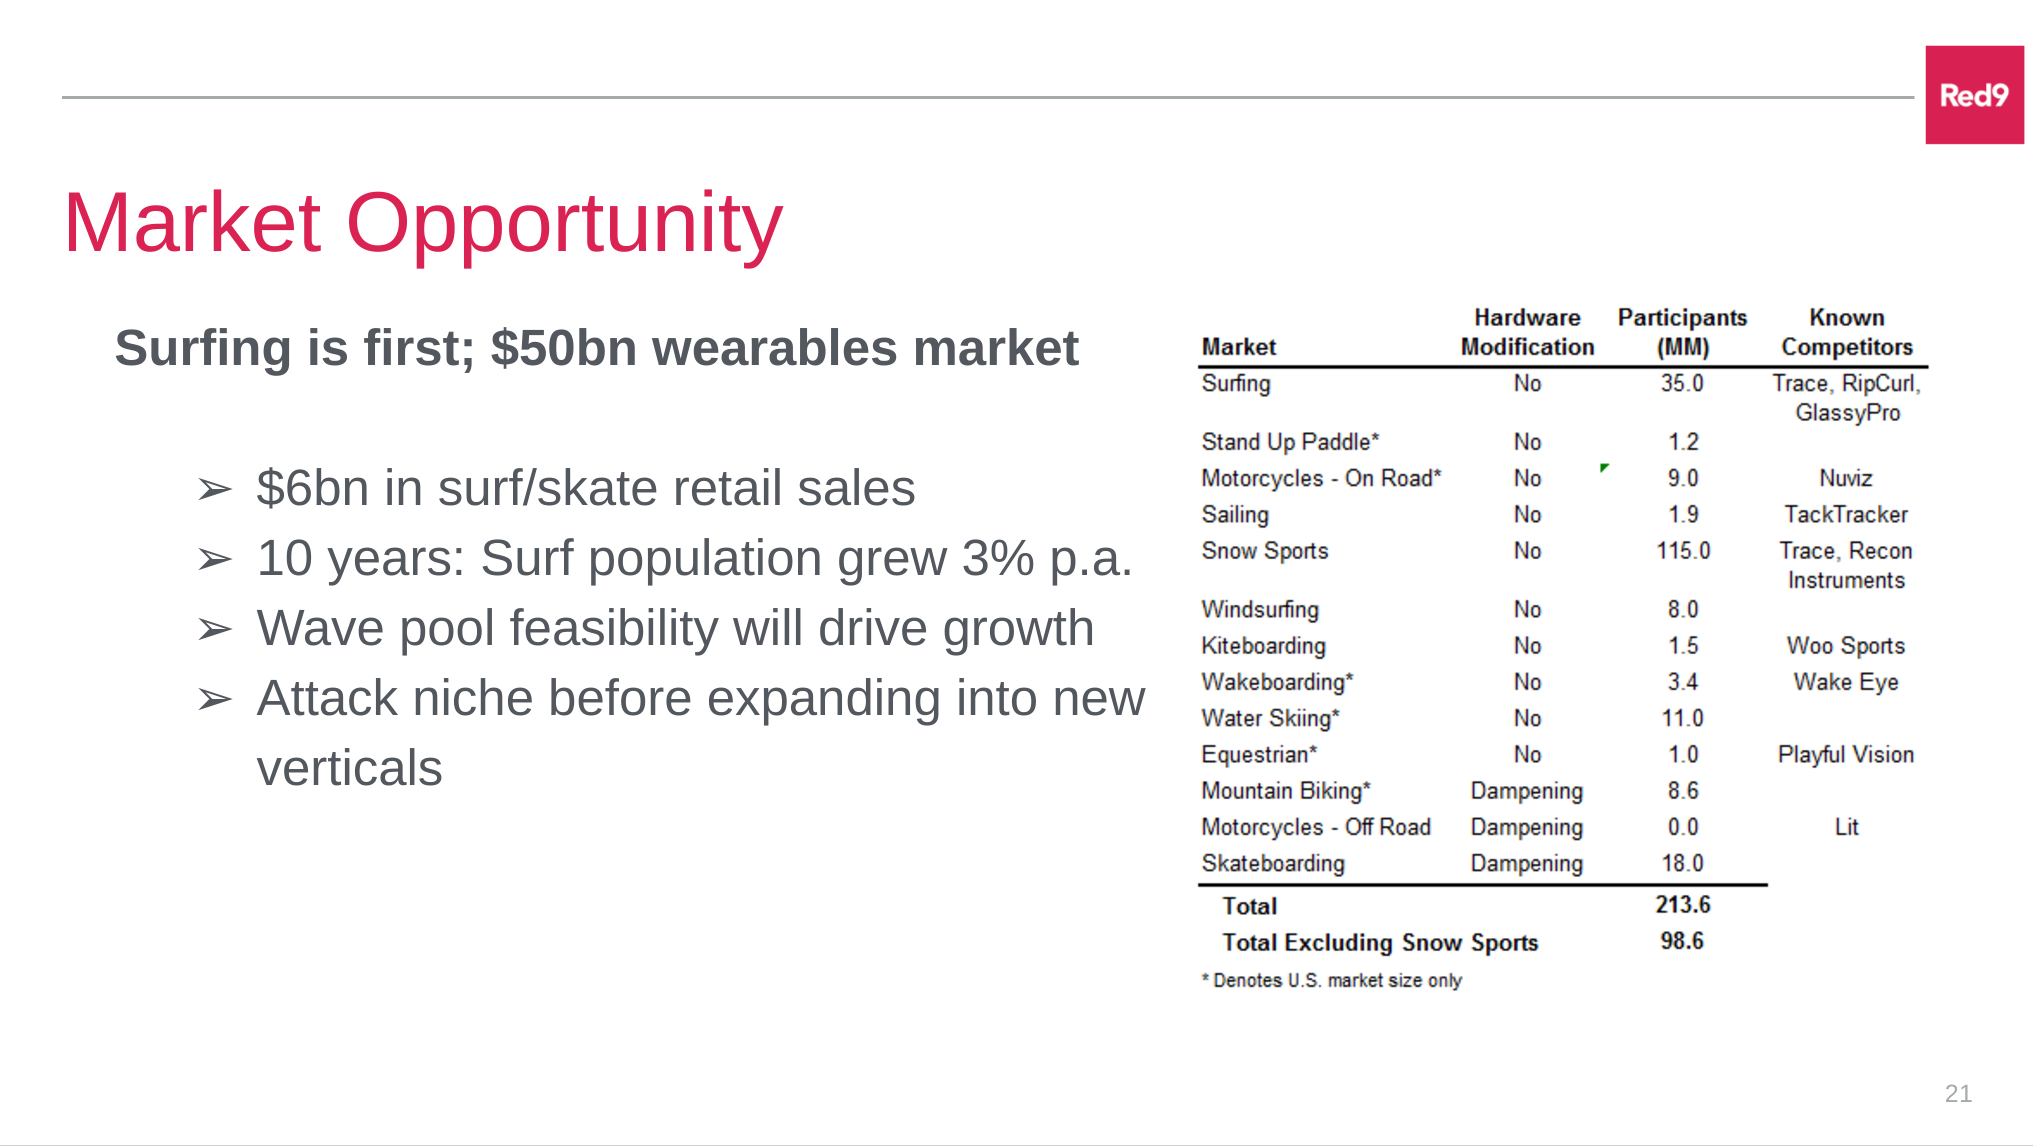
- The snow market is much bigger than surf, in both number of people and per capita spending. There’s about 380 ski resorts in North America, and about 1156 surf shops. Personal experience indicates that there’s about 1000s of people per day at a ski resort, but only 10s at a surf shop. Even with a 2/3 of the year without snow I think ski resorts see much more traffic, and with a much lower barrier to spending.
- Surfing does not have any clear schedule. With snow you can structure your company around the winter season, with annual product releases. Things at Red9 would take months because of the unscheduled nature of surfing.
- Surfing is a bifurcated culture with respect to technology. About half love technology, and half will resist all electronics and data collection while surfing. And even if a particular surfer is pro-technology there is significant peer pressure to not use it.
The choice of surf instead of snow is only one of the Red9 fatal flaws. The second fatal flaw is what killed us: lack of full time commitment.
This flaw is a bit more sensitive, and I’d like to start it off by saying that I hold no ill feelings towards anyone. From the beginning of Red9 until the end, I was the only full time employee. Others (notably Akhil, Shyama, and Ben) had different periods where they worked full time for a few weeks on Red9, but eventually each had to return to work or school.
For this flaw, I’m specifically talking about time commitment, and not financial or emotional commitment (both of which there was plenty of). The lack of time commitment had two major impacts on the company: less work output and a poor impression with investors.
The less work output is pretty obvious. When you have a full time, high stress job (as everybody did during the course of Red9) it’s hard to come home and put in a good three or four hours of work on a side project, and dedicate weekends as well. Because everybody had their own jobs, we also all worked remotely which dramatically slowed down communication. Things would take months instead of days, which exerted a psychological toll on the team. And due to the distributed nature of Red9, I still have not met some of my Red9 coworkers in person.
The distributed nature of Red9 taught me that working from home is one of the most draining things you can do. It’s easy to get into a rut of boredom and lack of progress, and not being able to communicate with your coworkers is incredibly lonely. Being the sole technical person only compounded the difficulties for me. When you can’t bounce ideas off anybody, or get a sanity check, and you’re the only one making progress on a major part of the company, it becomes tough to stay focused and motivated.
The second point is that not having team members with “skin in the game” looks bad to investors. This point is purely my conjecture, based on what I’ve read and heard about. From an investor’s point of view, if a team can’t commit and take a risk then the investor won’t risk putting his money with the team.
Everybody has their own reasons for not going full time, and I don’t judge them for it or hold it against them. It was the fact that they kept their jobs, and hence could keep putting money into Red9 to support our startup, that kept me in a job for three years. So while I think the part time commitment was detrimental to the success of the company, it did allow me to continue having a job for which I am very grateful.
What should we have done? We should have fixed both problems. Switch to snow in the autumn, rent a place by a mountain for two or three months, bring everybody to one location and with a singular focus, and churn out prototype after prototype and VC meeting after VC meeting. We would have burned through all of our money pretty quick, sure, but we would have had some incredible focus that we never managed to achieve when dispersed and part time.
Overall, I’m glad to have worked with Red9 for three years. I learned an incredible amount about web development, data analysis, embedded systems, PCB design, user testing, devops, startup design, VC funding, marketing, initiative, and teamwork.
I was given great freedom to make technical choices and experiments, had great work flexibility, and I had fun while I was at it. I enjoyed working with Mike and Mica, Jeff, Akhil, Shyama, Jaysen, Ben, Kellie, Merwan, and Jorge. These three years taught me that I can do or make anything. It might take a while, and I’ll certainly make mistakes along the way, but the startup world is not a mystery to me any more.
I’d like to say thanks to Mike, Mica, and Ben. It was a great time.
The product that we almost, but never quite, made.
Addendum: I wrote the bulk of this post over a year and a half ago in fall 2016, and since them I’ve had time to reflect on the conclusions I reached about why Red9 failed. This winter I tried out SkiApp PRO, a $4 Android app. I was pretty surprised by how good it is: it tracks my runs fairly accurately, my battery lasts all day, and I can easily review the two metrics that I care about: top speed and total distance. This experience makes me think that maybe we got the whole thing wrong to begin with by building a hardware device. There’s room in the app market for a well crafted and social snow app.